
Introduction
Dodo Payments’ Analytics & Reporting dashboard empowers you to monitor your business performance, understand customer behavior, and make data-driven decisions. Access real-time metrics, visualize trends, and export detailed reports—all from a single, intuitive interface.Business-Level Analytics
Product-Level Analytics
Page Highlight Tiles
Exportable Reports
Business-Level Analytics
The main Analytics dashboard provides comprehensive insights across your entire business. Access it from Home in the sidebar. The dashboard is organized into six tabs, each with its own filters:Revenue
Customers
Subscriptions
Retention
Success Rate
Recovery
Filtering & Customization
Most tabs support the following filters:- Time Period: Today, Yesterday, This/Last Week, This/Last Month, This/Last Year, All Time, or a Custom date range.
- Product: Scope analytics to a single product.
- Product Type: One-time vs. subscription (Customers and Retention tabs).
- Payment Method: Filter the Success Rate tab by payment method.
Revenue Tab
Track your income and payment activity to understand revenue trends and identify your top-performing markets.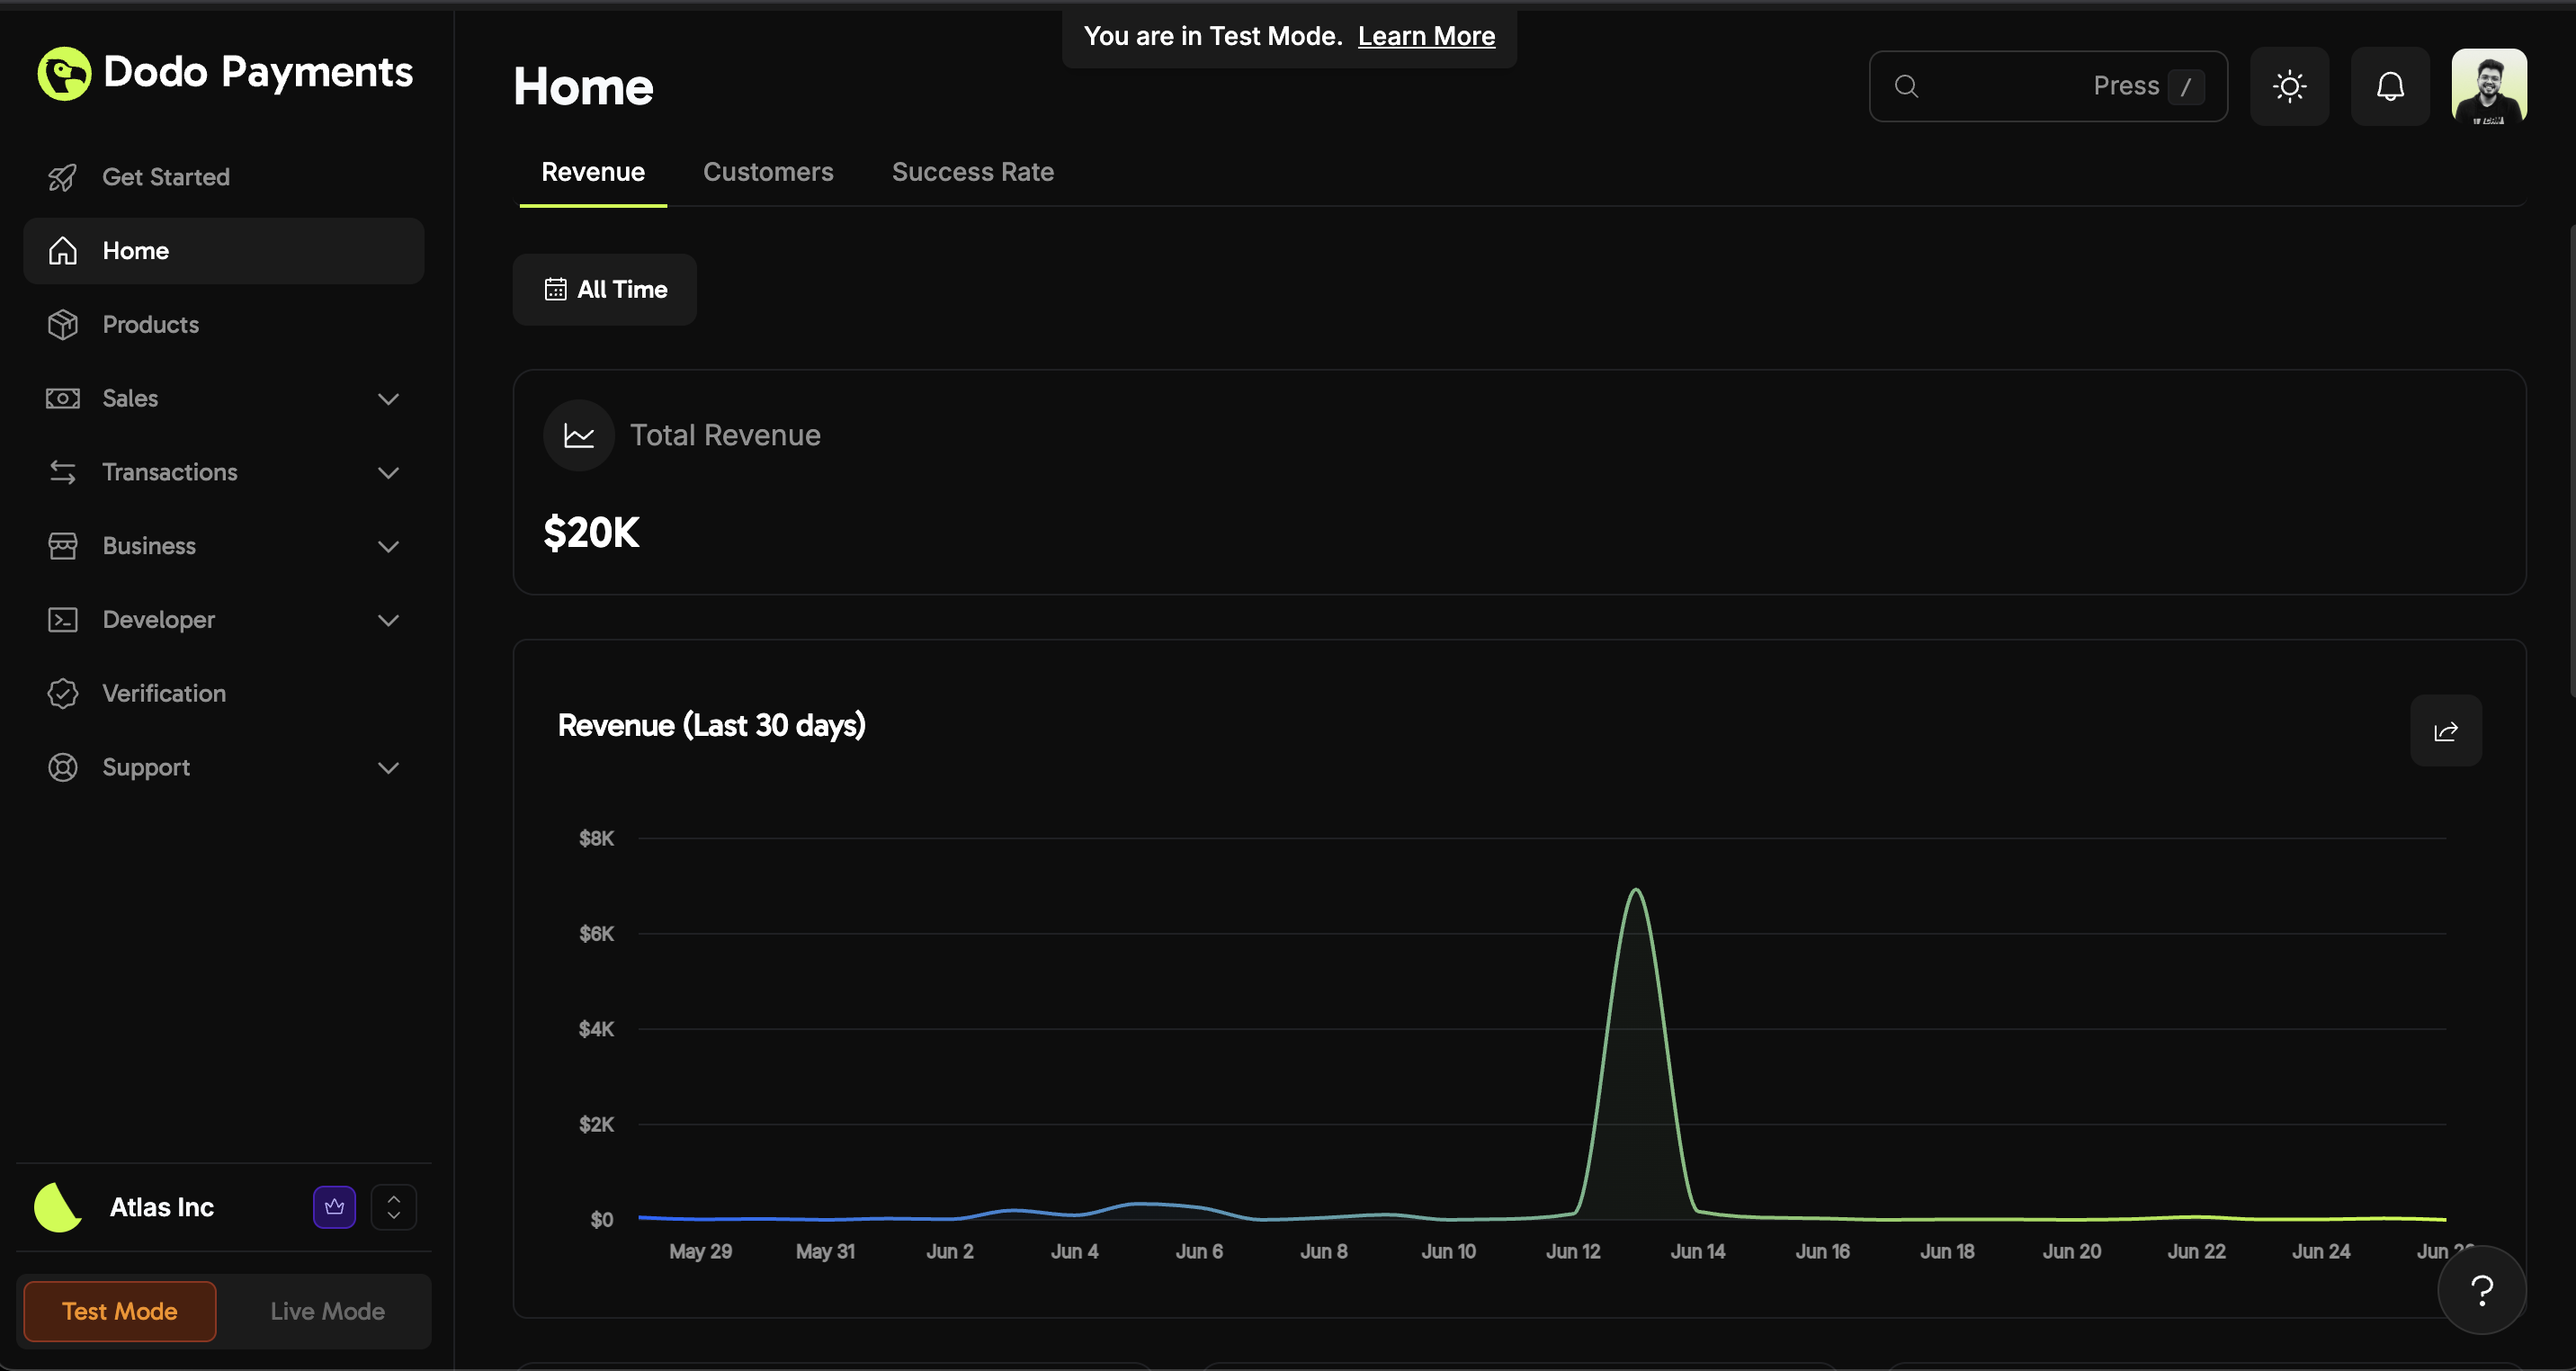
Total revenue and 30-day trend
- Gross / Net Revenue Toggle: Use the Gross/Net dropdown to switch the headline revenue figure, the 30-day chart, the monthly bars, and the top-countries ranking between gross and net values.
- Gross Revenue: Total revenue before deductions.
- Net Revenue: Actual earnings after refunds and lost or accepted disputes, for a clear picture of true business performance.
- Revenue (Last 30 Days): A trend chart that helps you spot spikes or dips in income. Toggle between cumulative and daily views.
- Payments Count, Total Refunds, Payouts Received: Supporting activity metrics for the selected period.
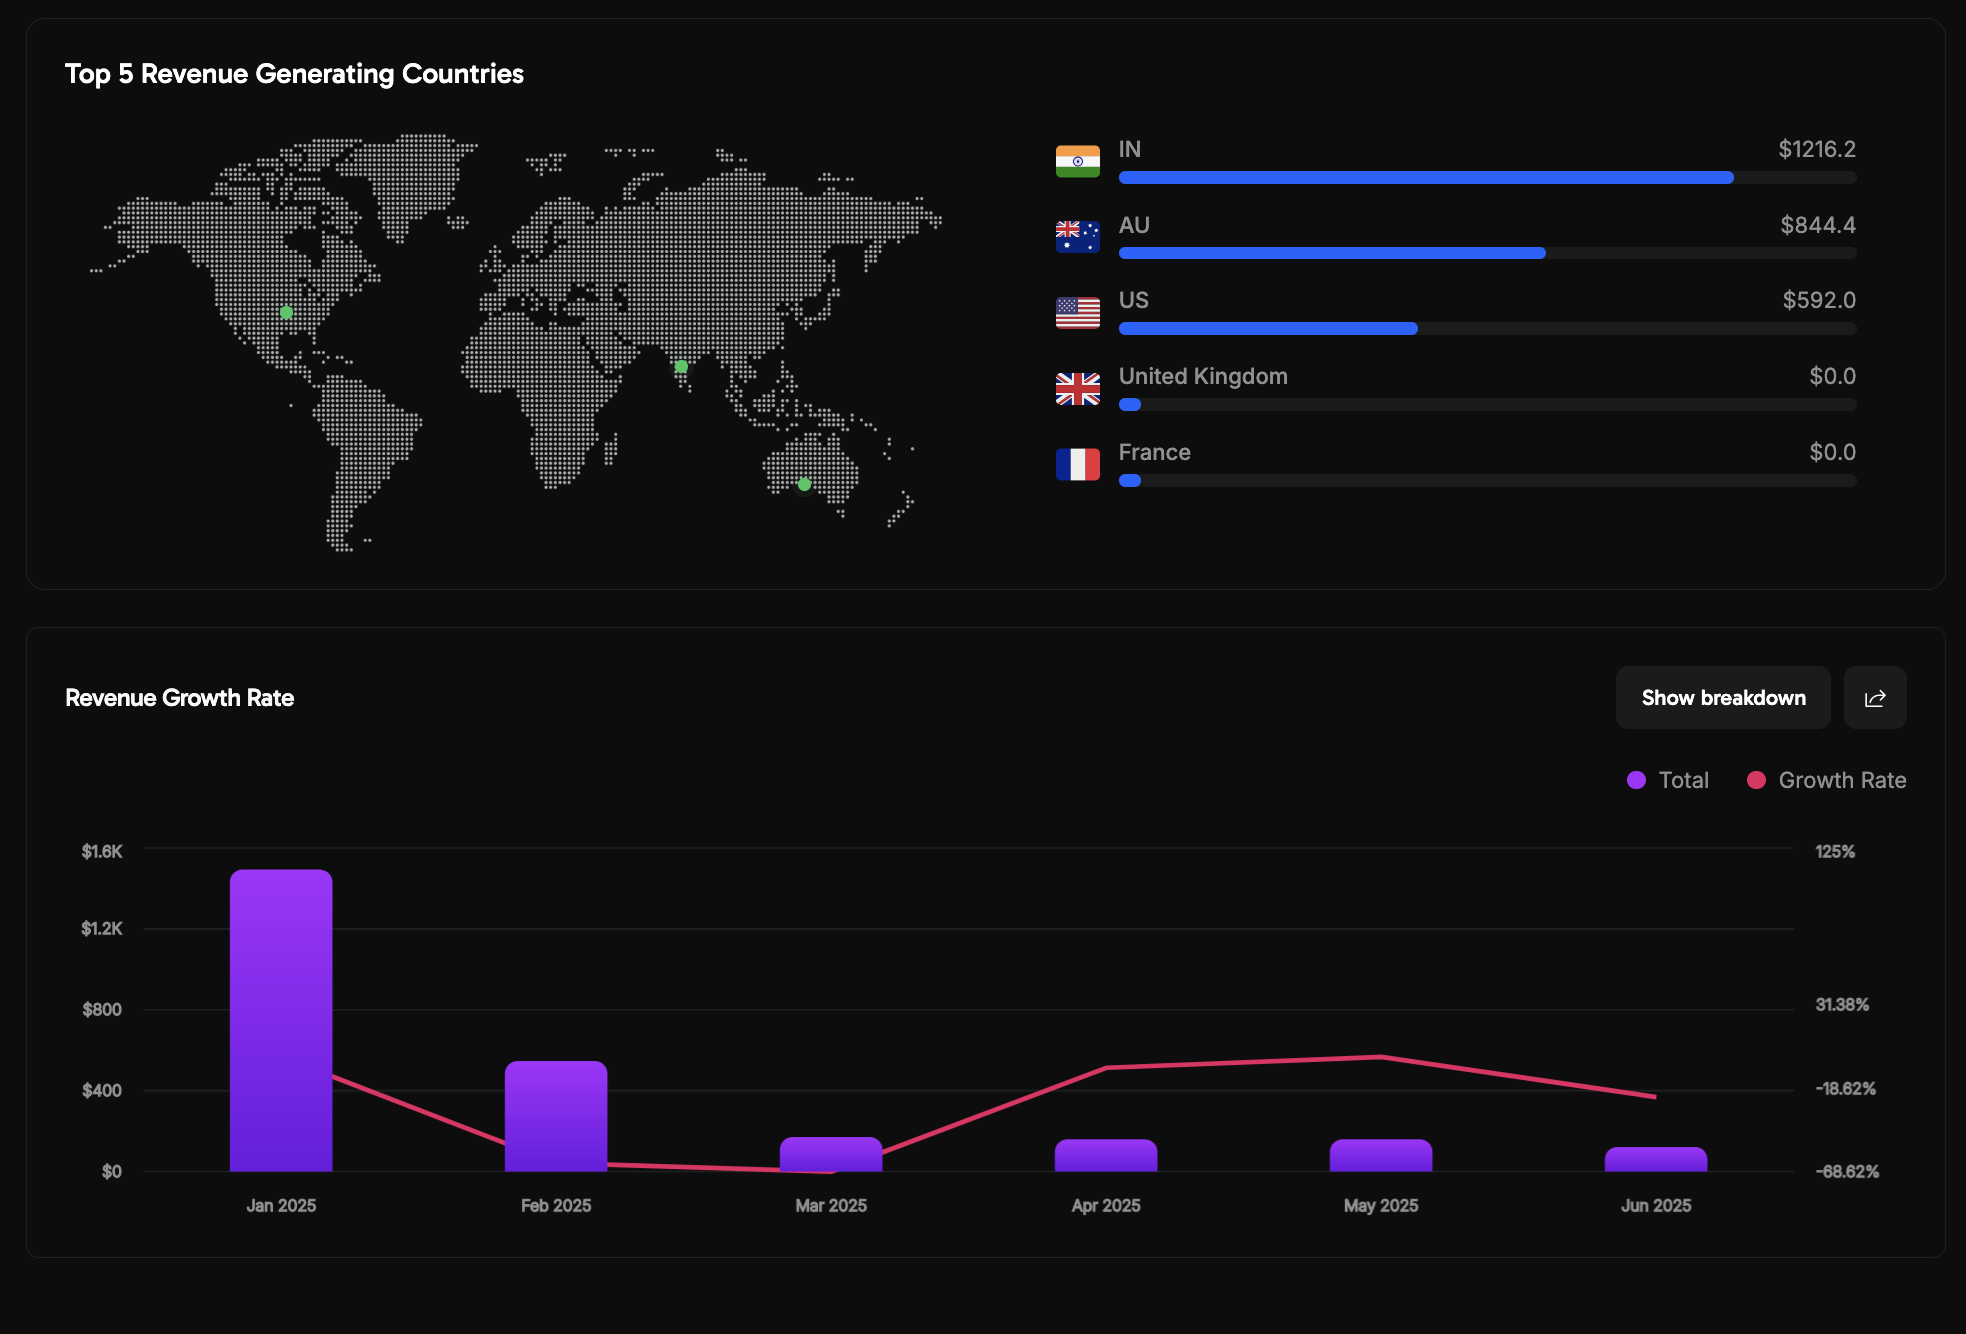
Top 5 revenue-generating countries and growth rate
- Growth Rate: Track month-over-month revenue growth (subscription, non-subscription, and total) to measure business momentum.
- Geographic Insights: Visualize your top 5 revenue-generating countries, ranked by gross or net revenue based on the toggle.
Customers Tab
Analyze customer acquisition, retention, and spending patterns to optimize your customer strategy.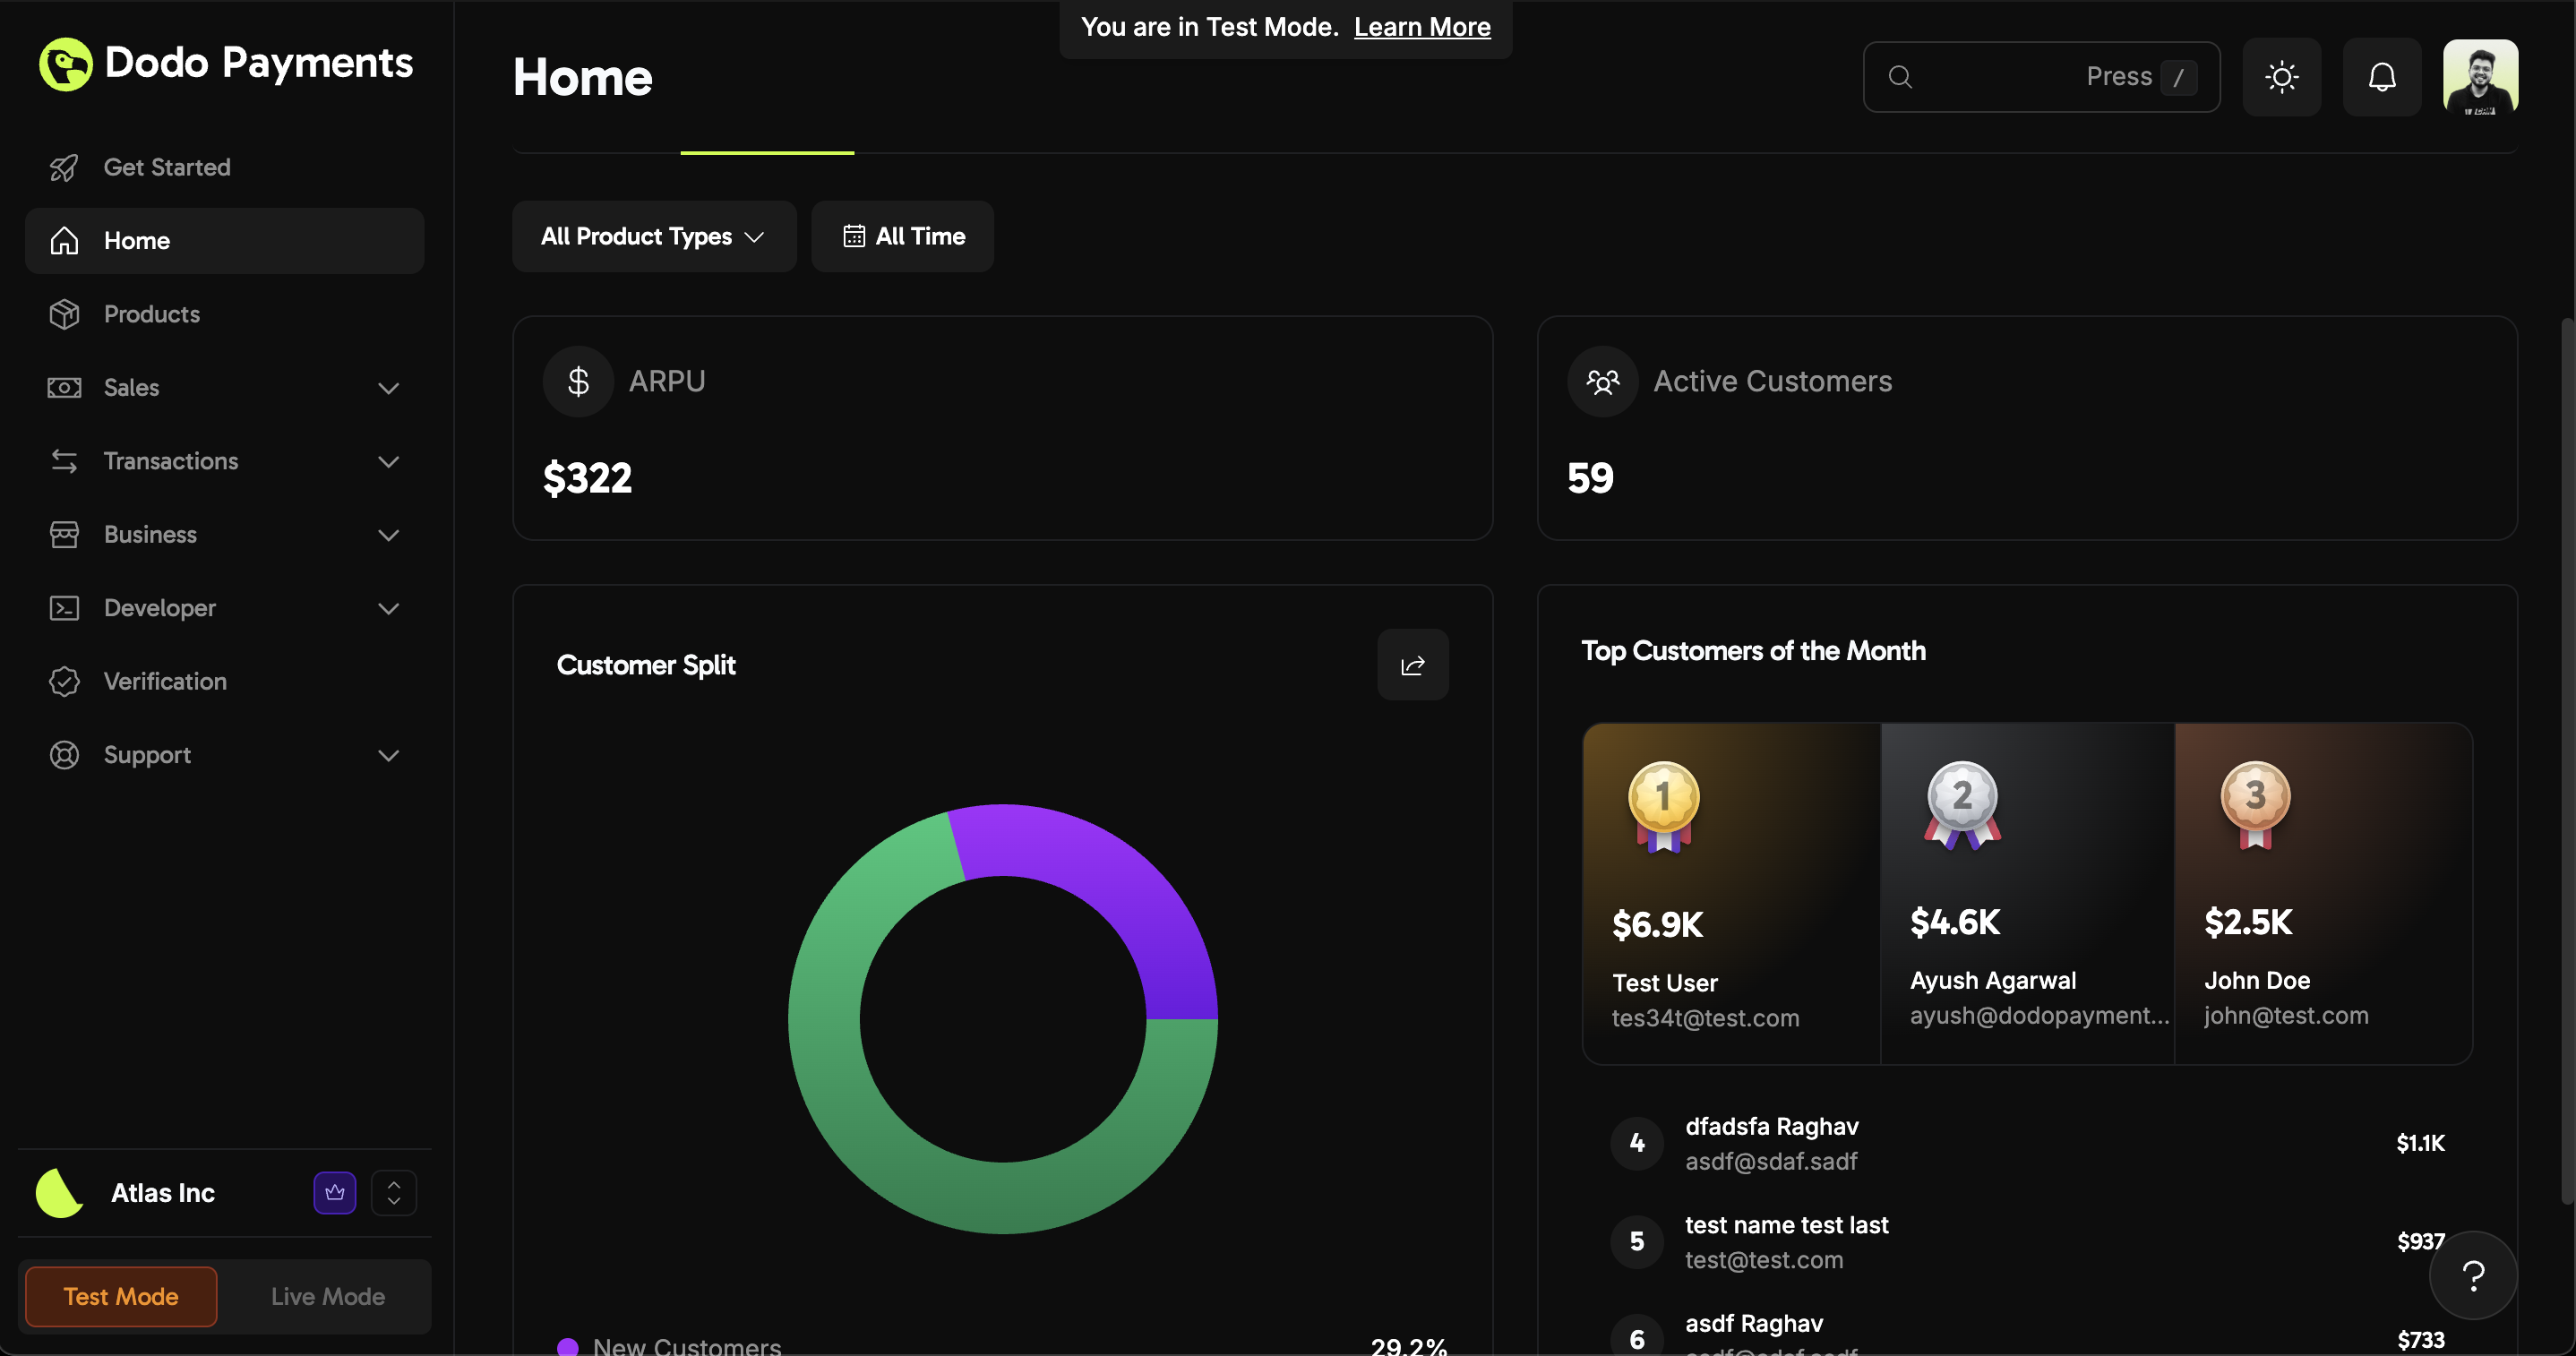
ARPU, active customers, customer split, and top customers
- Revenue Per User (ARPU): Understand how much each customer contributes on average. The Gross/Net toggle switches between gross and net ARPU.
- Active Customers: See how many customers are engaging with your business, including those with active subscriptions.
- Customer Split: Instantly view the ratio of new vs. returning customers.
- Top Customers (By Revenue): Identify your highest spenders for targeted engagement (honors the Gross/Net toggle).
Subscriptions Tab
Monitor your recurring revenue and understand how your Monthly Recurring Revenue (MRR) changes over time.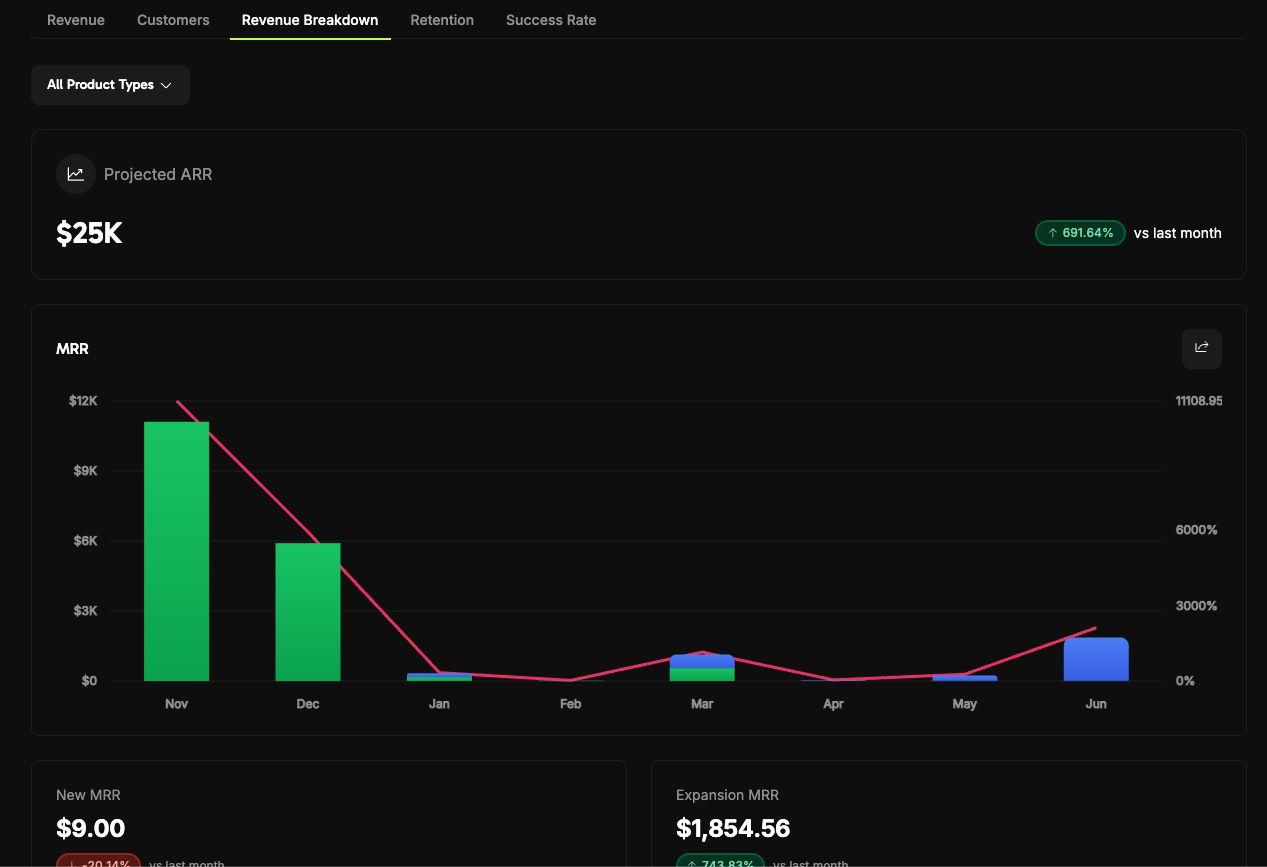
Revenue Breakdown dashboard showing projected ARR, MRR breakdown, and growth rates
- Current MRR: Your Monthly Recurring Revenue for the current month.
- Projected ARR: Annual Recurring Revenue projection (Current MRR × 12).
- Active Subscriptions: The number of subscriptions currently active.
Retention Tab
Monitor customer retention and churn patterns.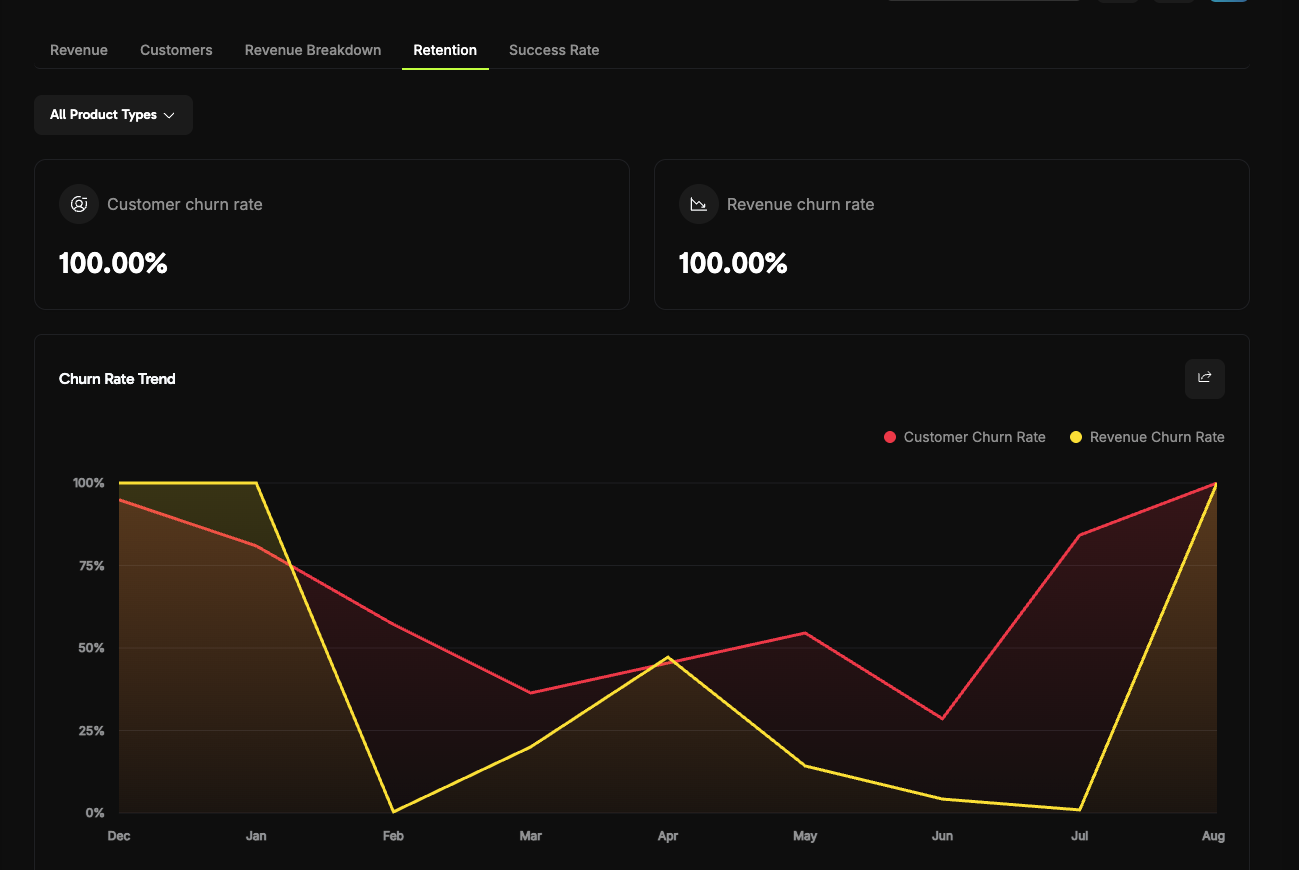
Retention Analytics showing churn rates and trends
- Customer Churn Rate: Percentage of customers who cancel their subscriptions.
- Revenue Churn Rate: Percentage of revenue lost from cancellations and downgrades. This now includes one-time payment revenue alongside recurring revenue, so customer and revenue churn cover the same population.
- Churn Rate Trends: Historical tracking of both customer and revenue churn over time.
- User Retention Matrix: Cohort analysis showing customer retention rates across different time periods.
Success Rate Tab
Monitor payment and refund success rates to identify and resolve transaction issues quickly.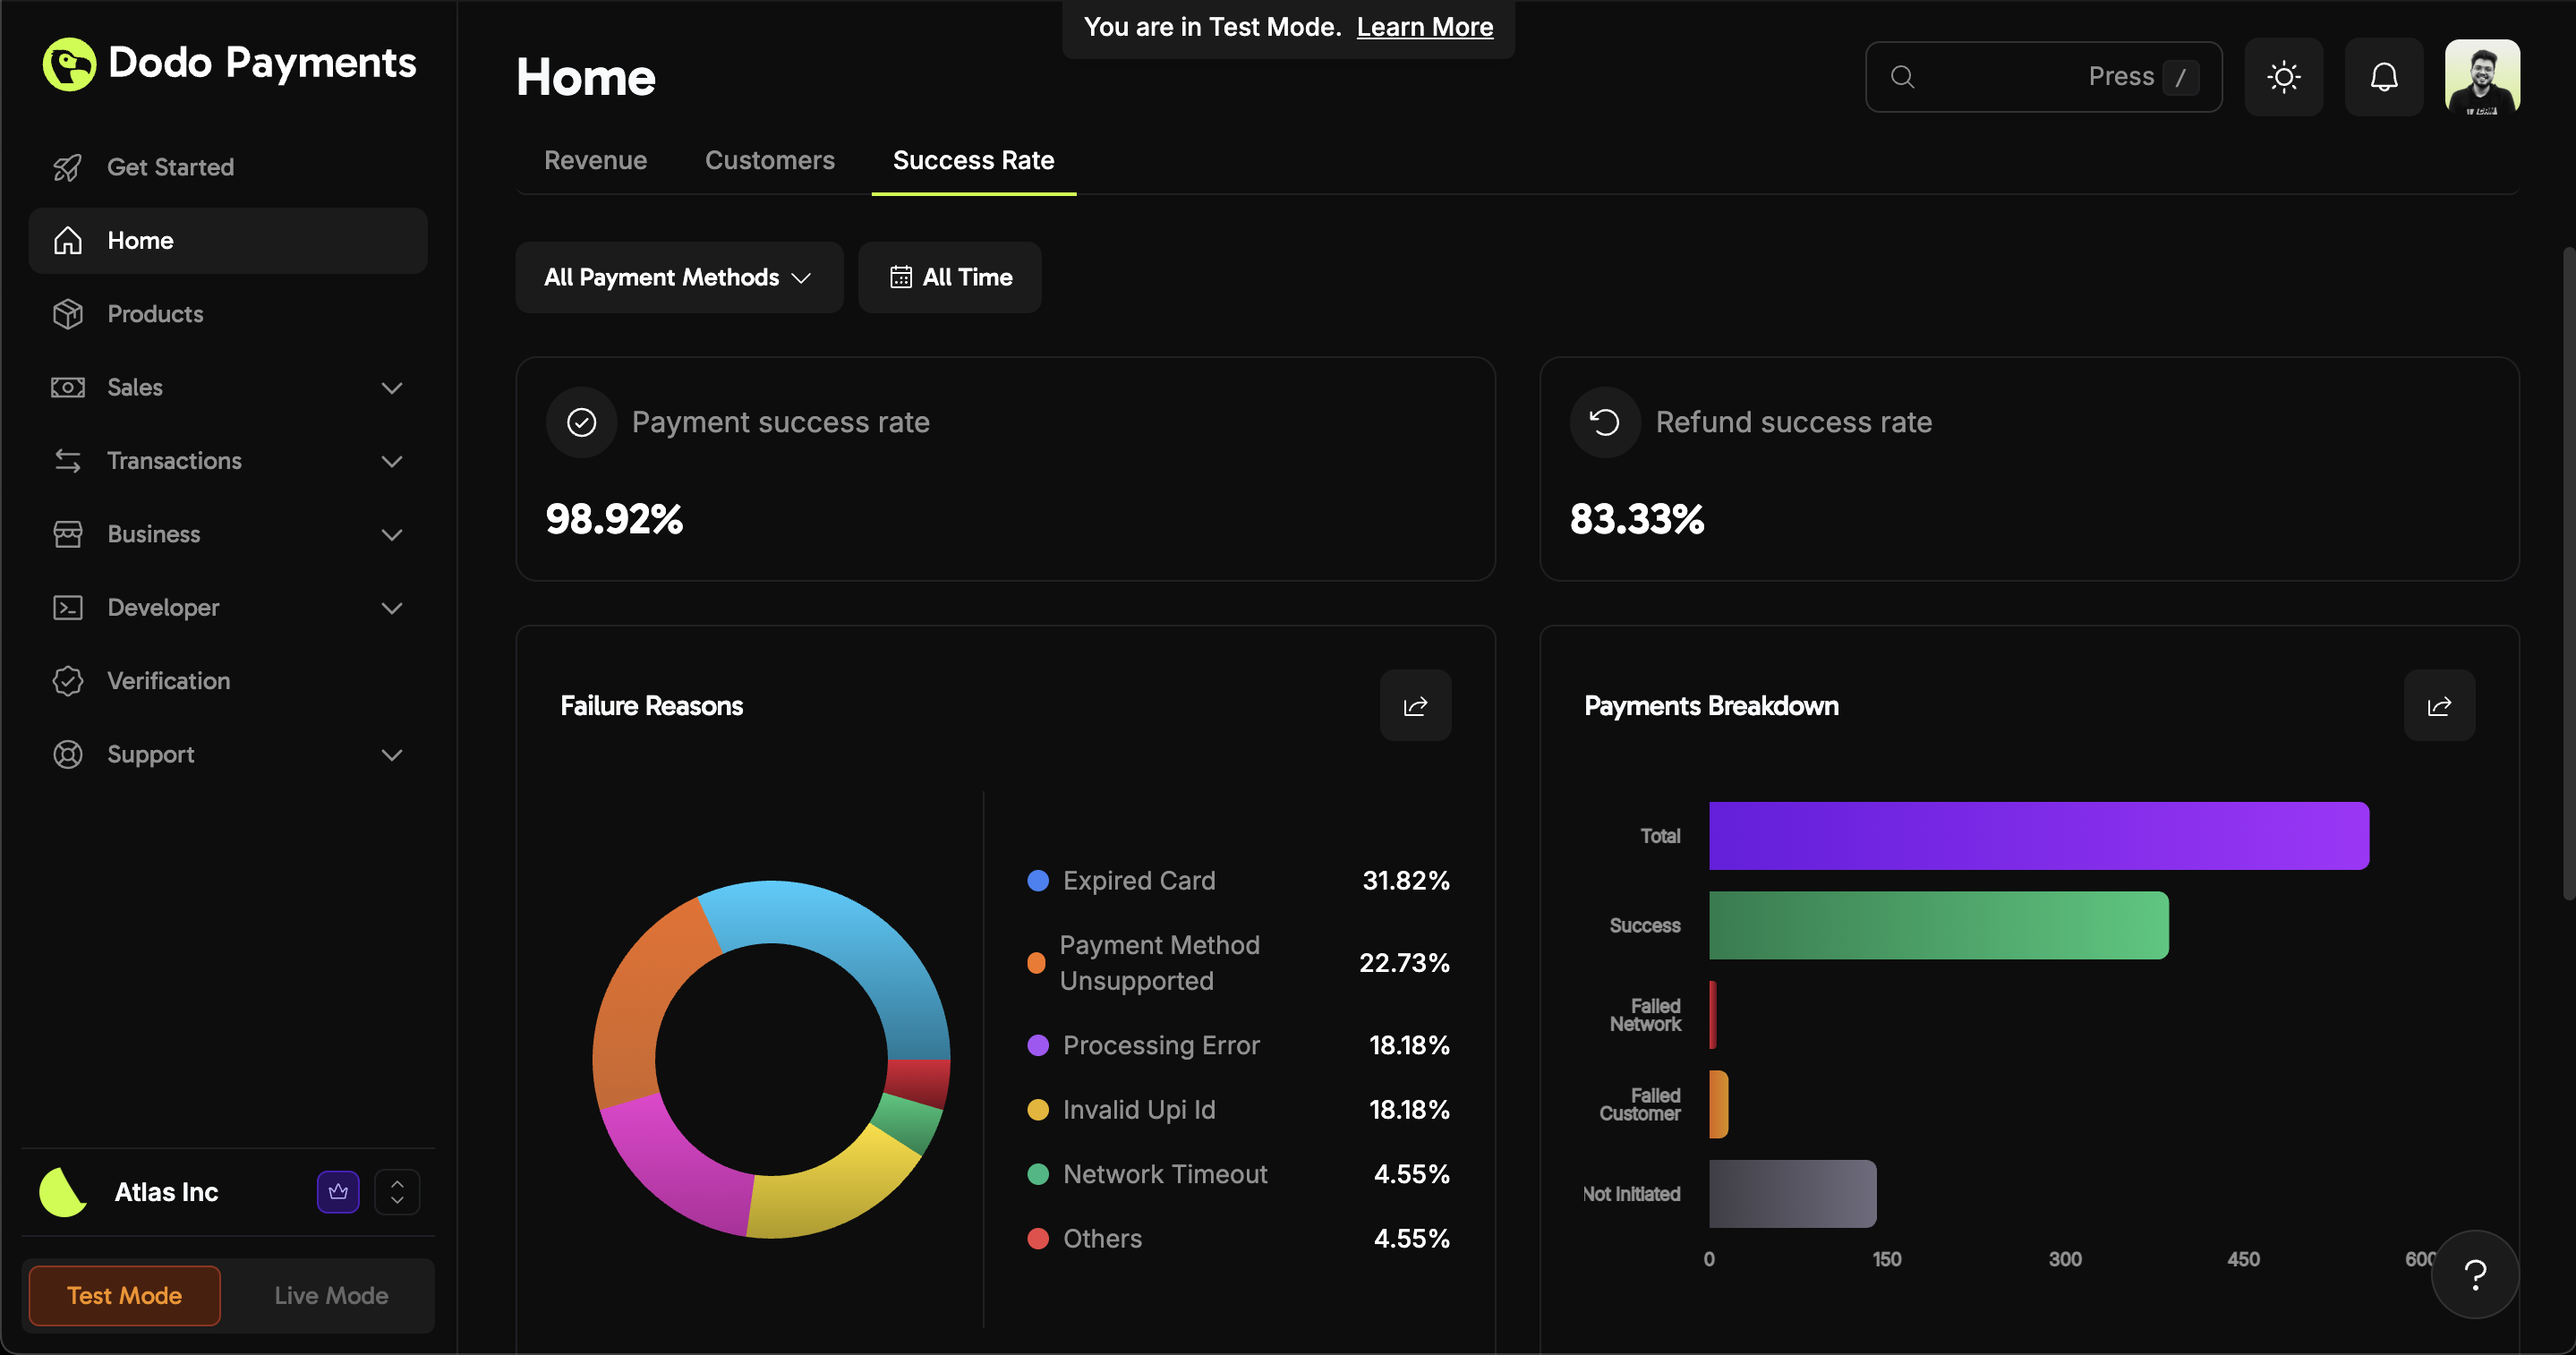
Payment/refund success rates, failure reasons, and payment breakdown
- Payment Success Rate: Track the percentage of successful payment attempts.
- Refund Success Rate: Monitor how many refunds are processed successfully.
-
Failure Reasons: Quickly identify common issues (e.g., expired cards, unsupported methods), split by customer-side and network-side errors.
Transaction Failure Reference
Get all possible transaction failure codes and their reasons. - Payments Breakdown: Visualize the distribution of successful and failed transactions.
Recovery Tab
Track how much revenue Dodo Payments recovers on your behalf through automated retries, dunning emails, and abandoned cart recovery.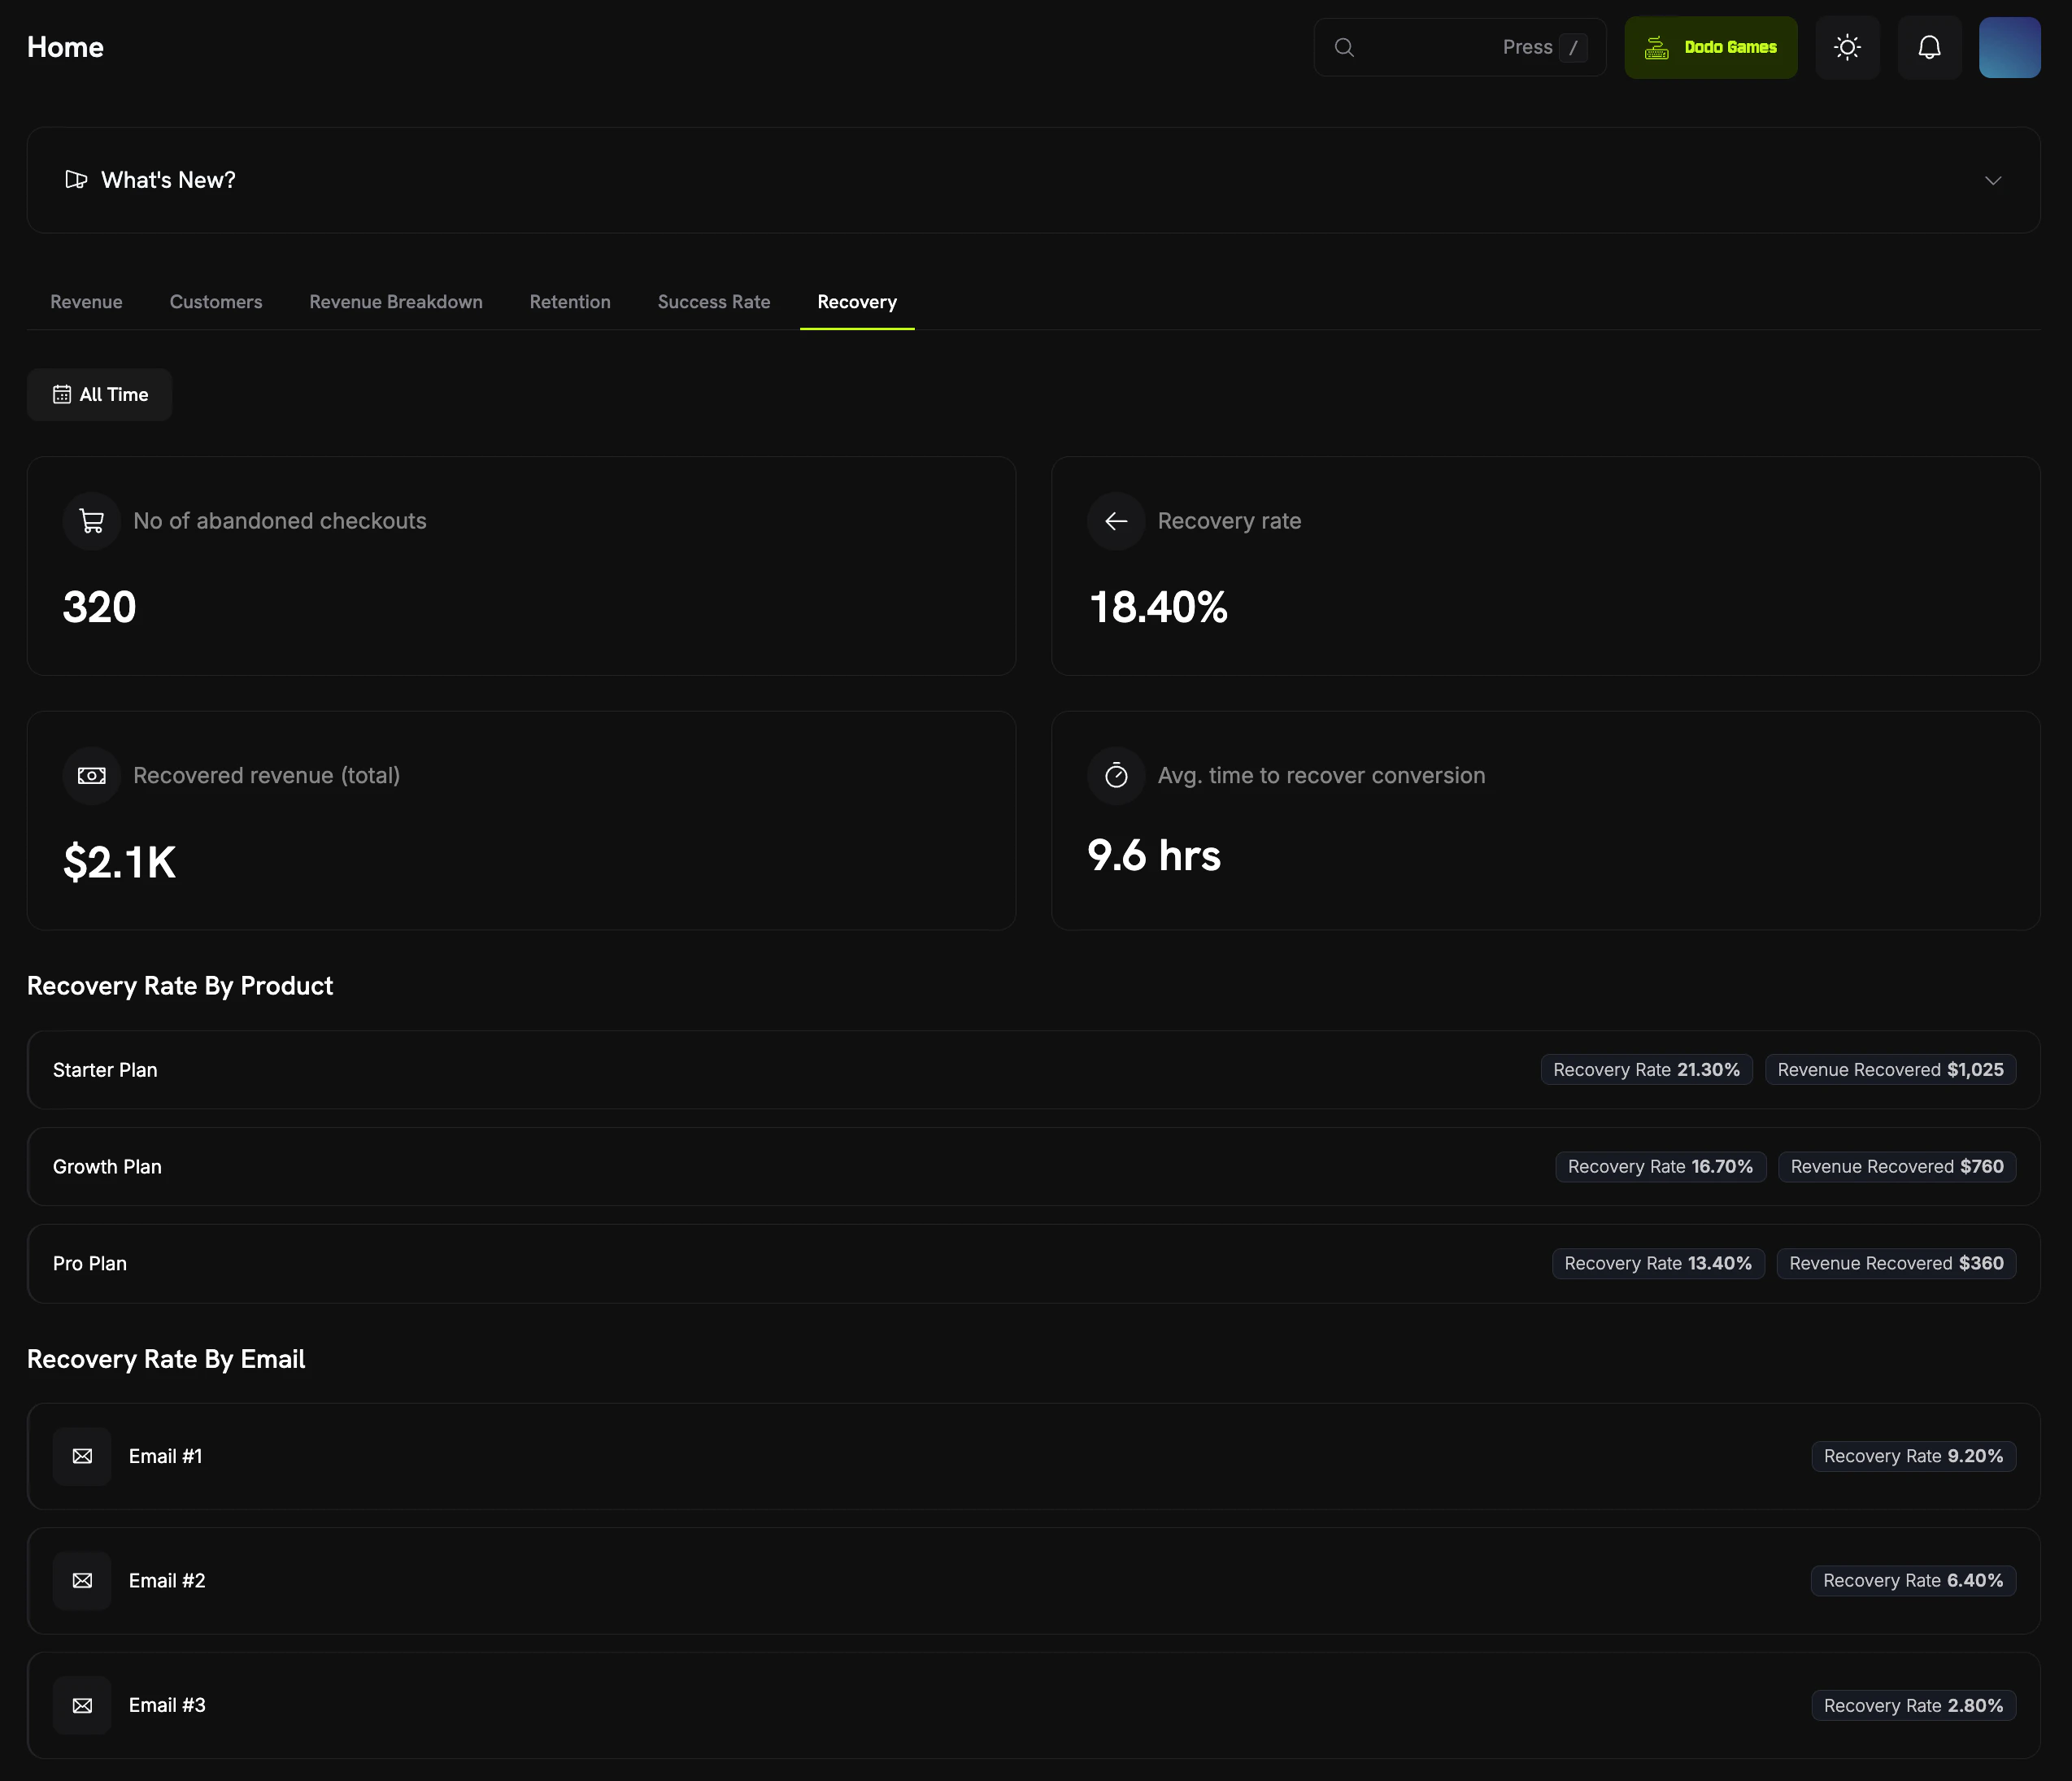
Recovery analytics showing payment retries, dunning, and abandoned cart recovery
- Payment Retries: Recover failed subscription renewals by automatically retrying the payment. Shows retry attempts, successful retries, retry success rate, subscriptions saved, and a “Retries by attempt” chart of attempted vs. succeeded retries.
- Dunning: Recover failed subscription payments with a sequence of reminder emails. Shows dunning entries, recovered revenue, emails sent, average time to recover, a recovery-rate donut, and recovery rate by email.
- Abandoned Cart Recovery: Recover shoppers who left before completing checkout. Shows abandoned checkouts, recovery rate, recovered revenue, average time to recover, and recovery rate by product and by email.
Recovery Features
Product-Level Analytics
Beyond business-wide metrics, you can view detailed analytics for each individual product. Navigate to Products > [Select a Product] to access a dedicated analytics dashboard for that product.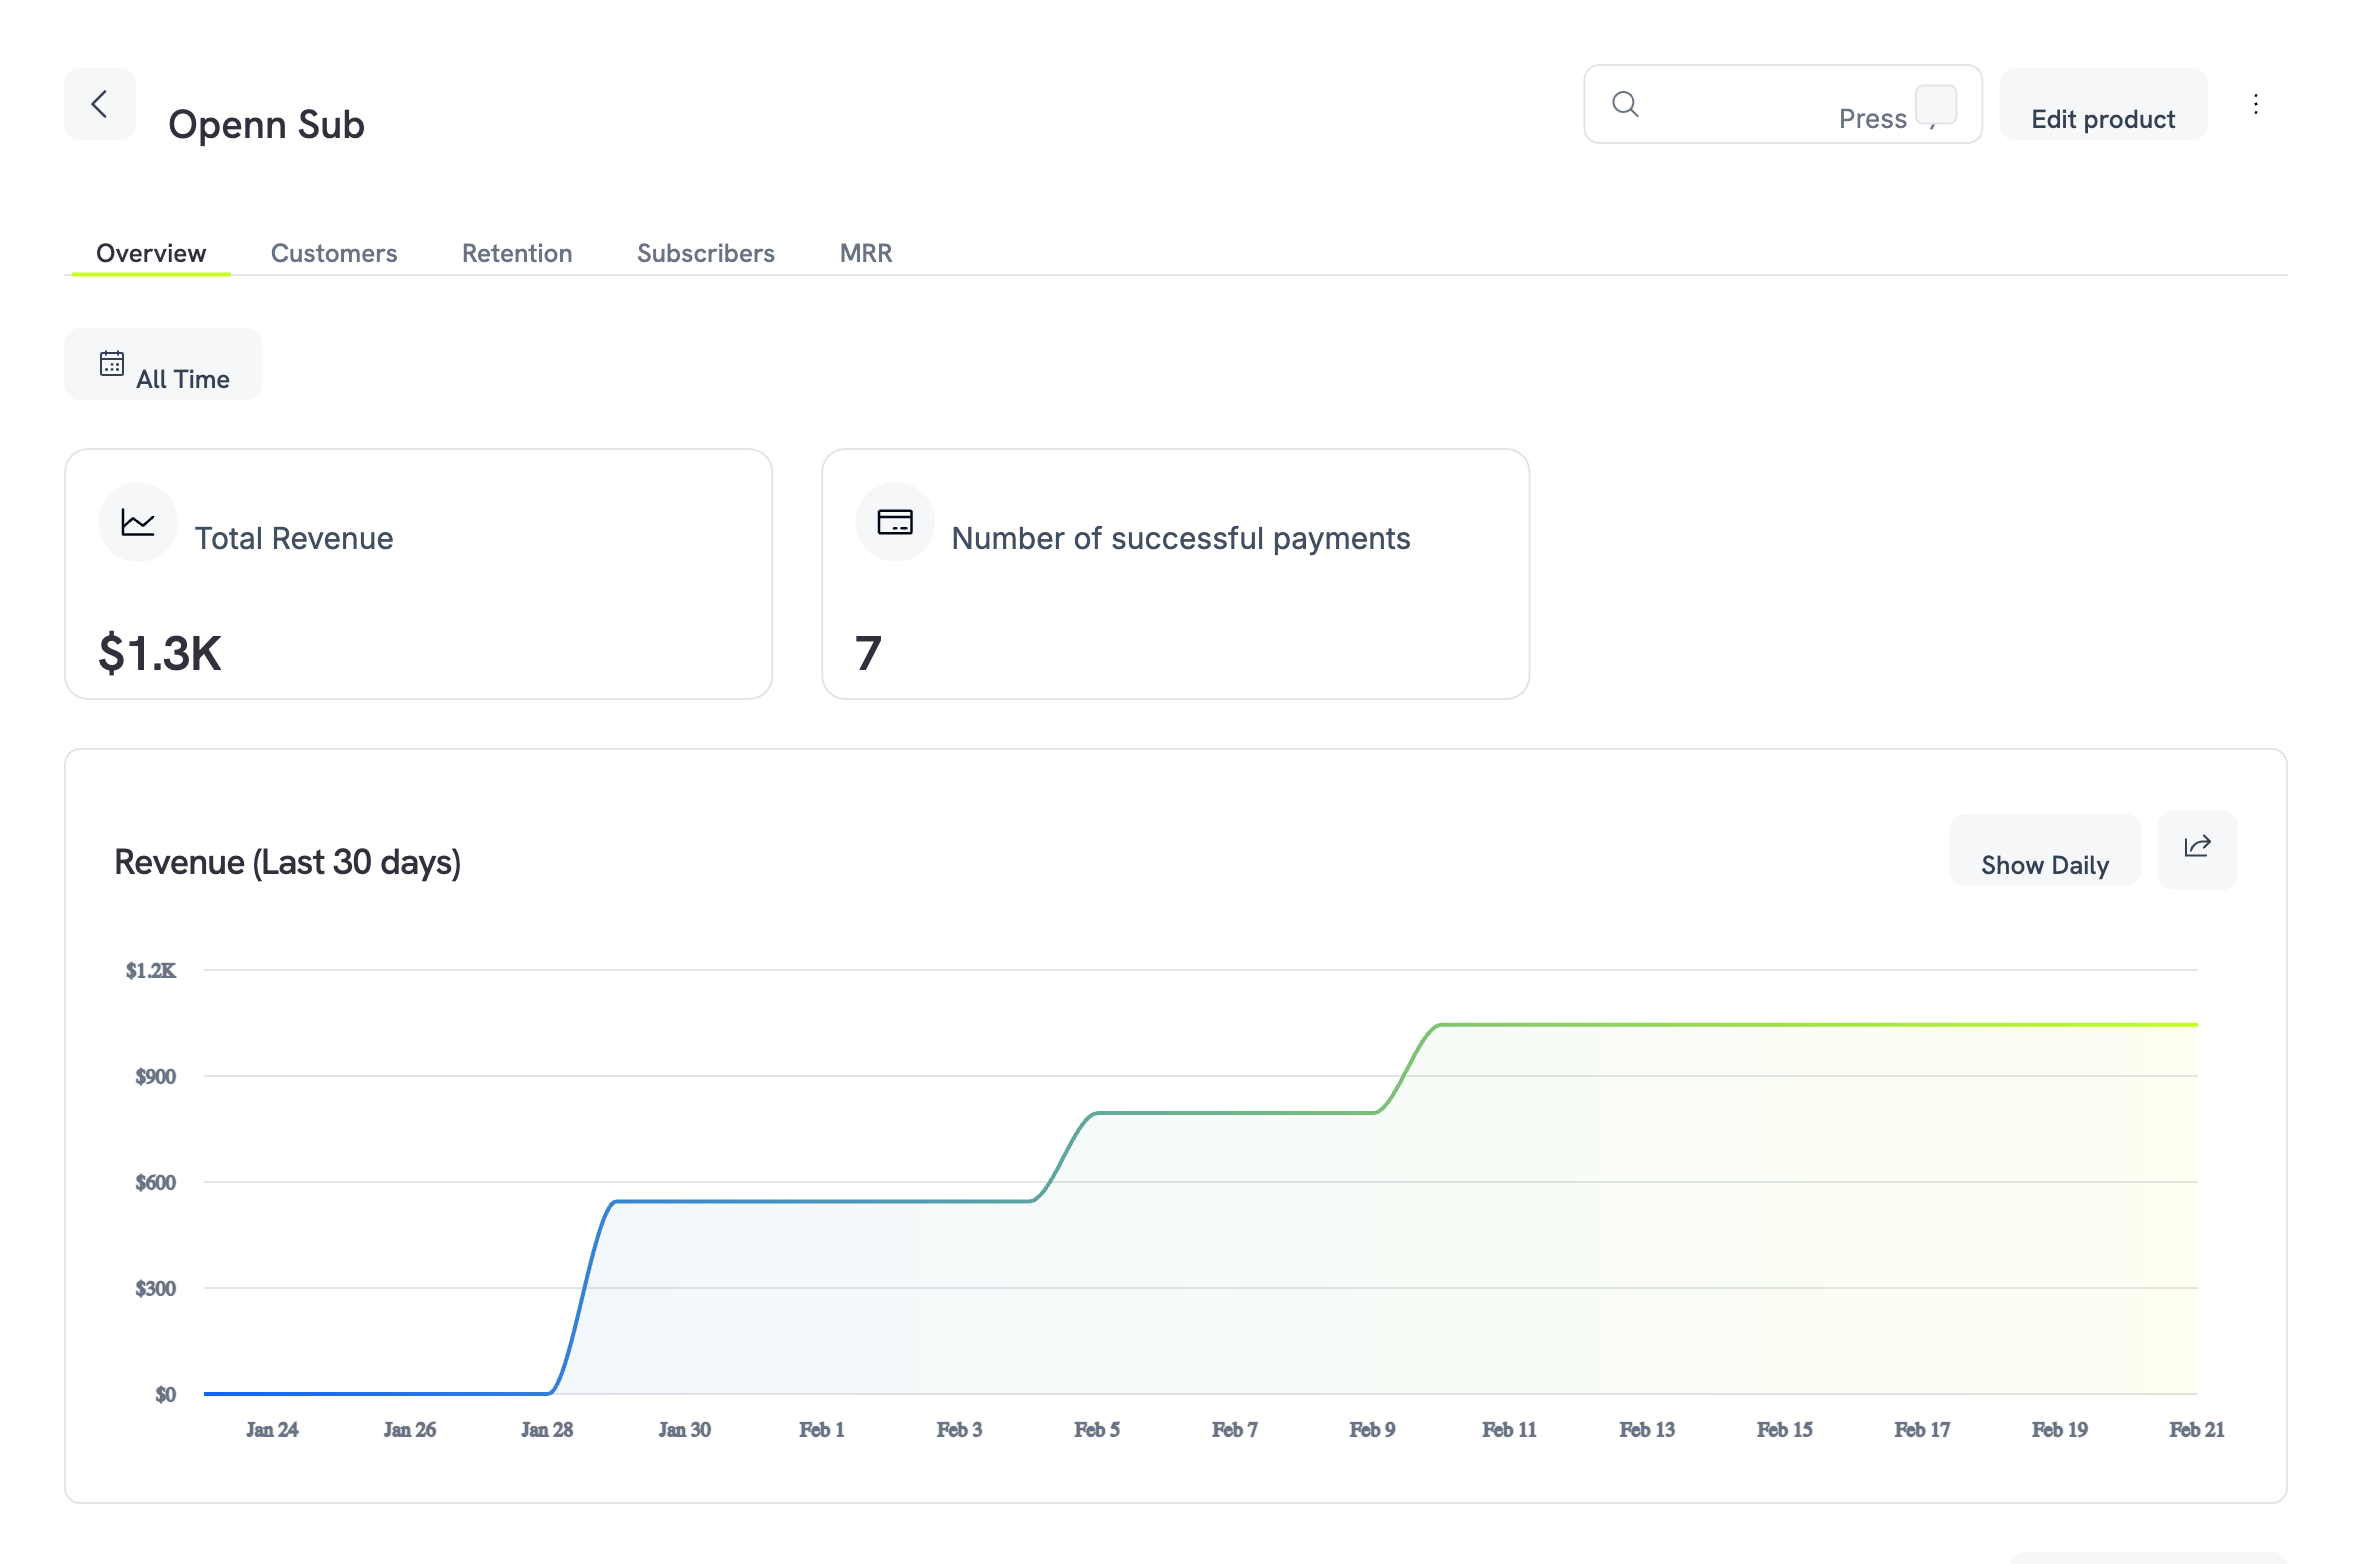
Product analytics overview showing revenue summary and trend chart
Overview
Customers
Retention
Subscribers
MRR
Overview Tab
The Overview tab provides a high-level snapshot of the product’s financial performance.- Total Revenue: Cumulative revenue generated by this product.
- Number of Successful Payments: Total count of successful transactions.
- Revenue Trend Chart: A 30-day line chart showing revenue over time. Toggle between cumulative and daily views using the Show Daily button.
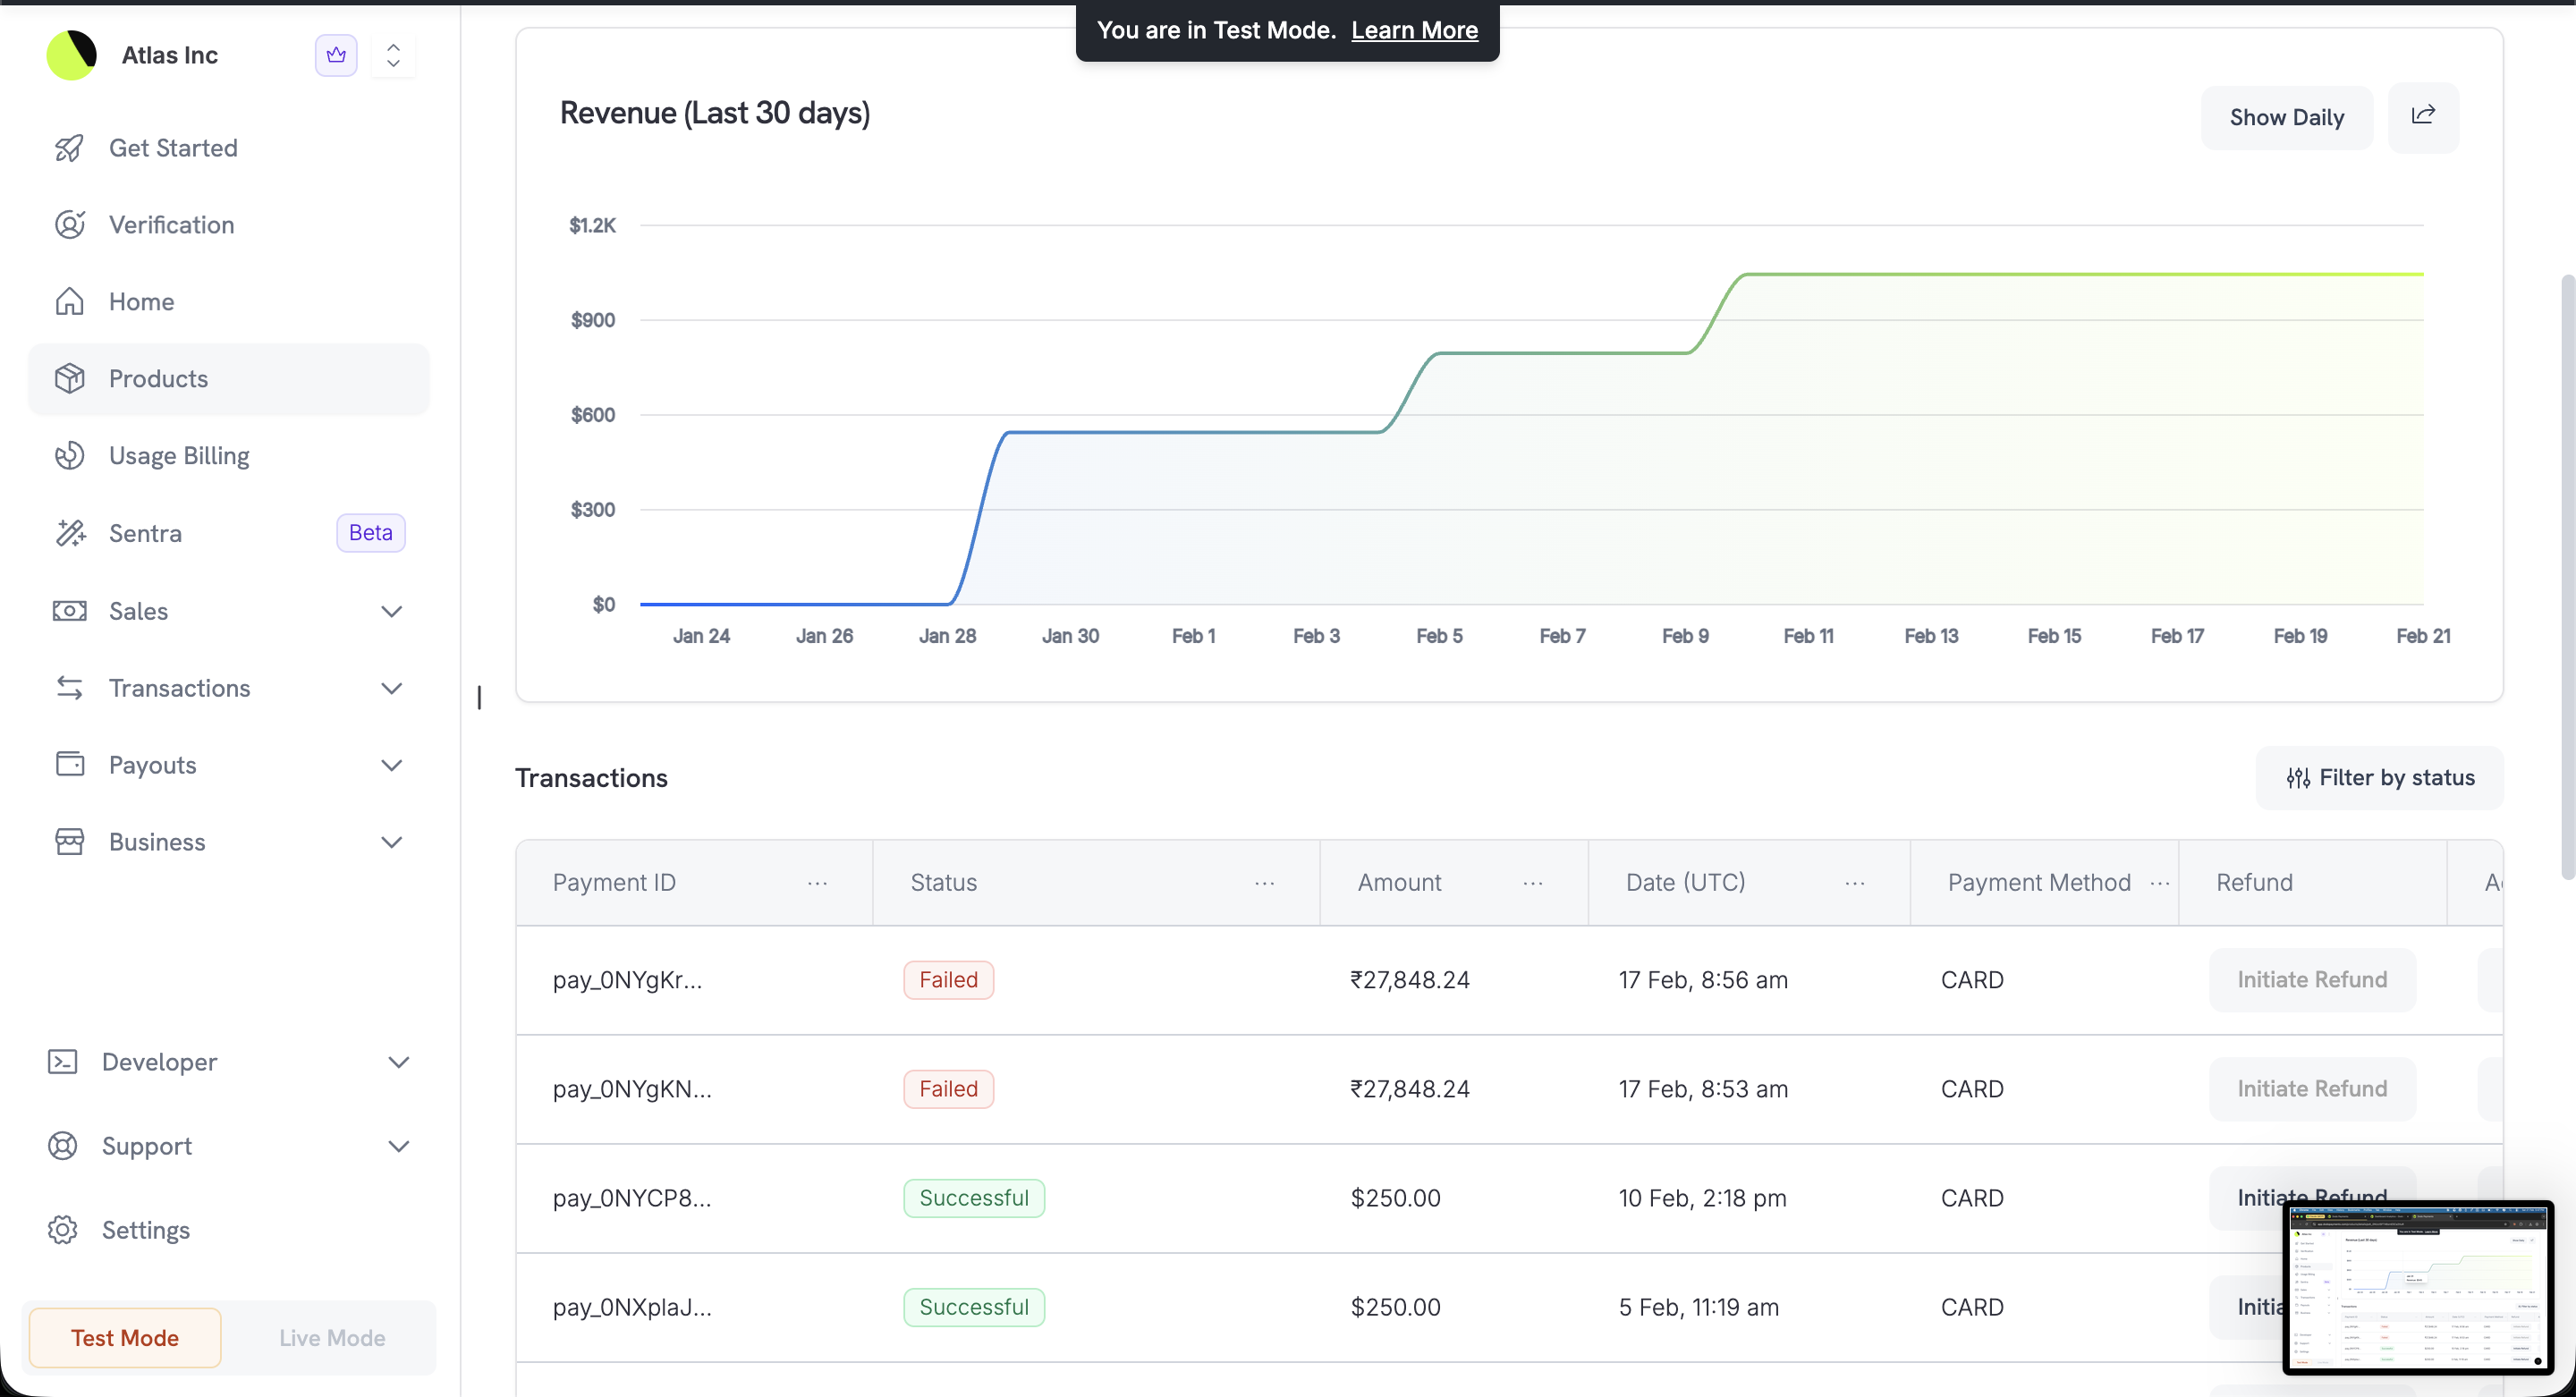
Transactions table showing payment history for the product
Customers Tab
See who is buying this product and how much they’re spending.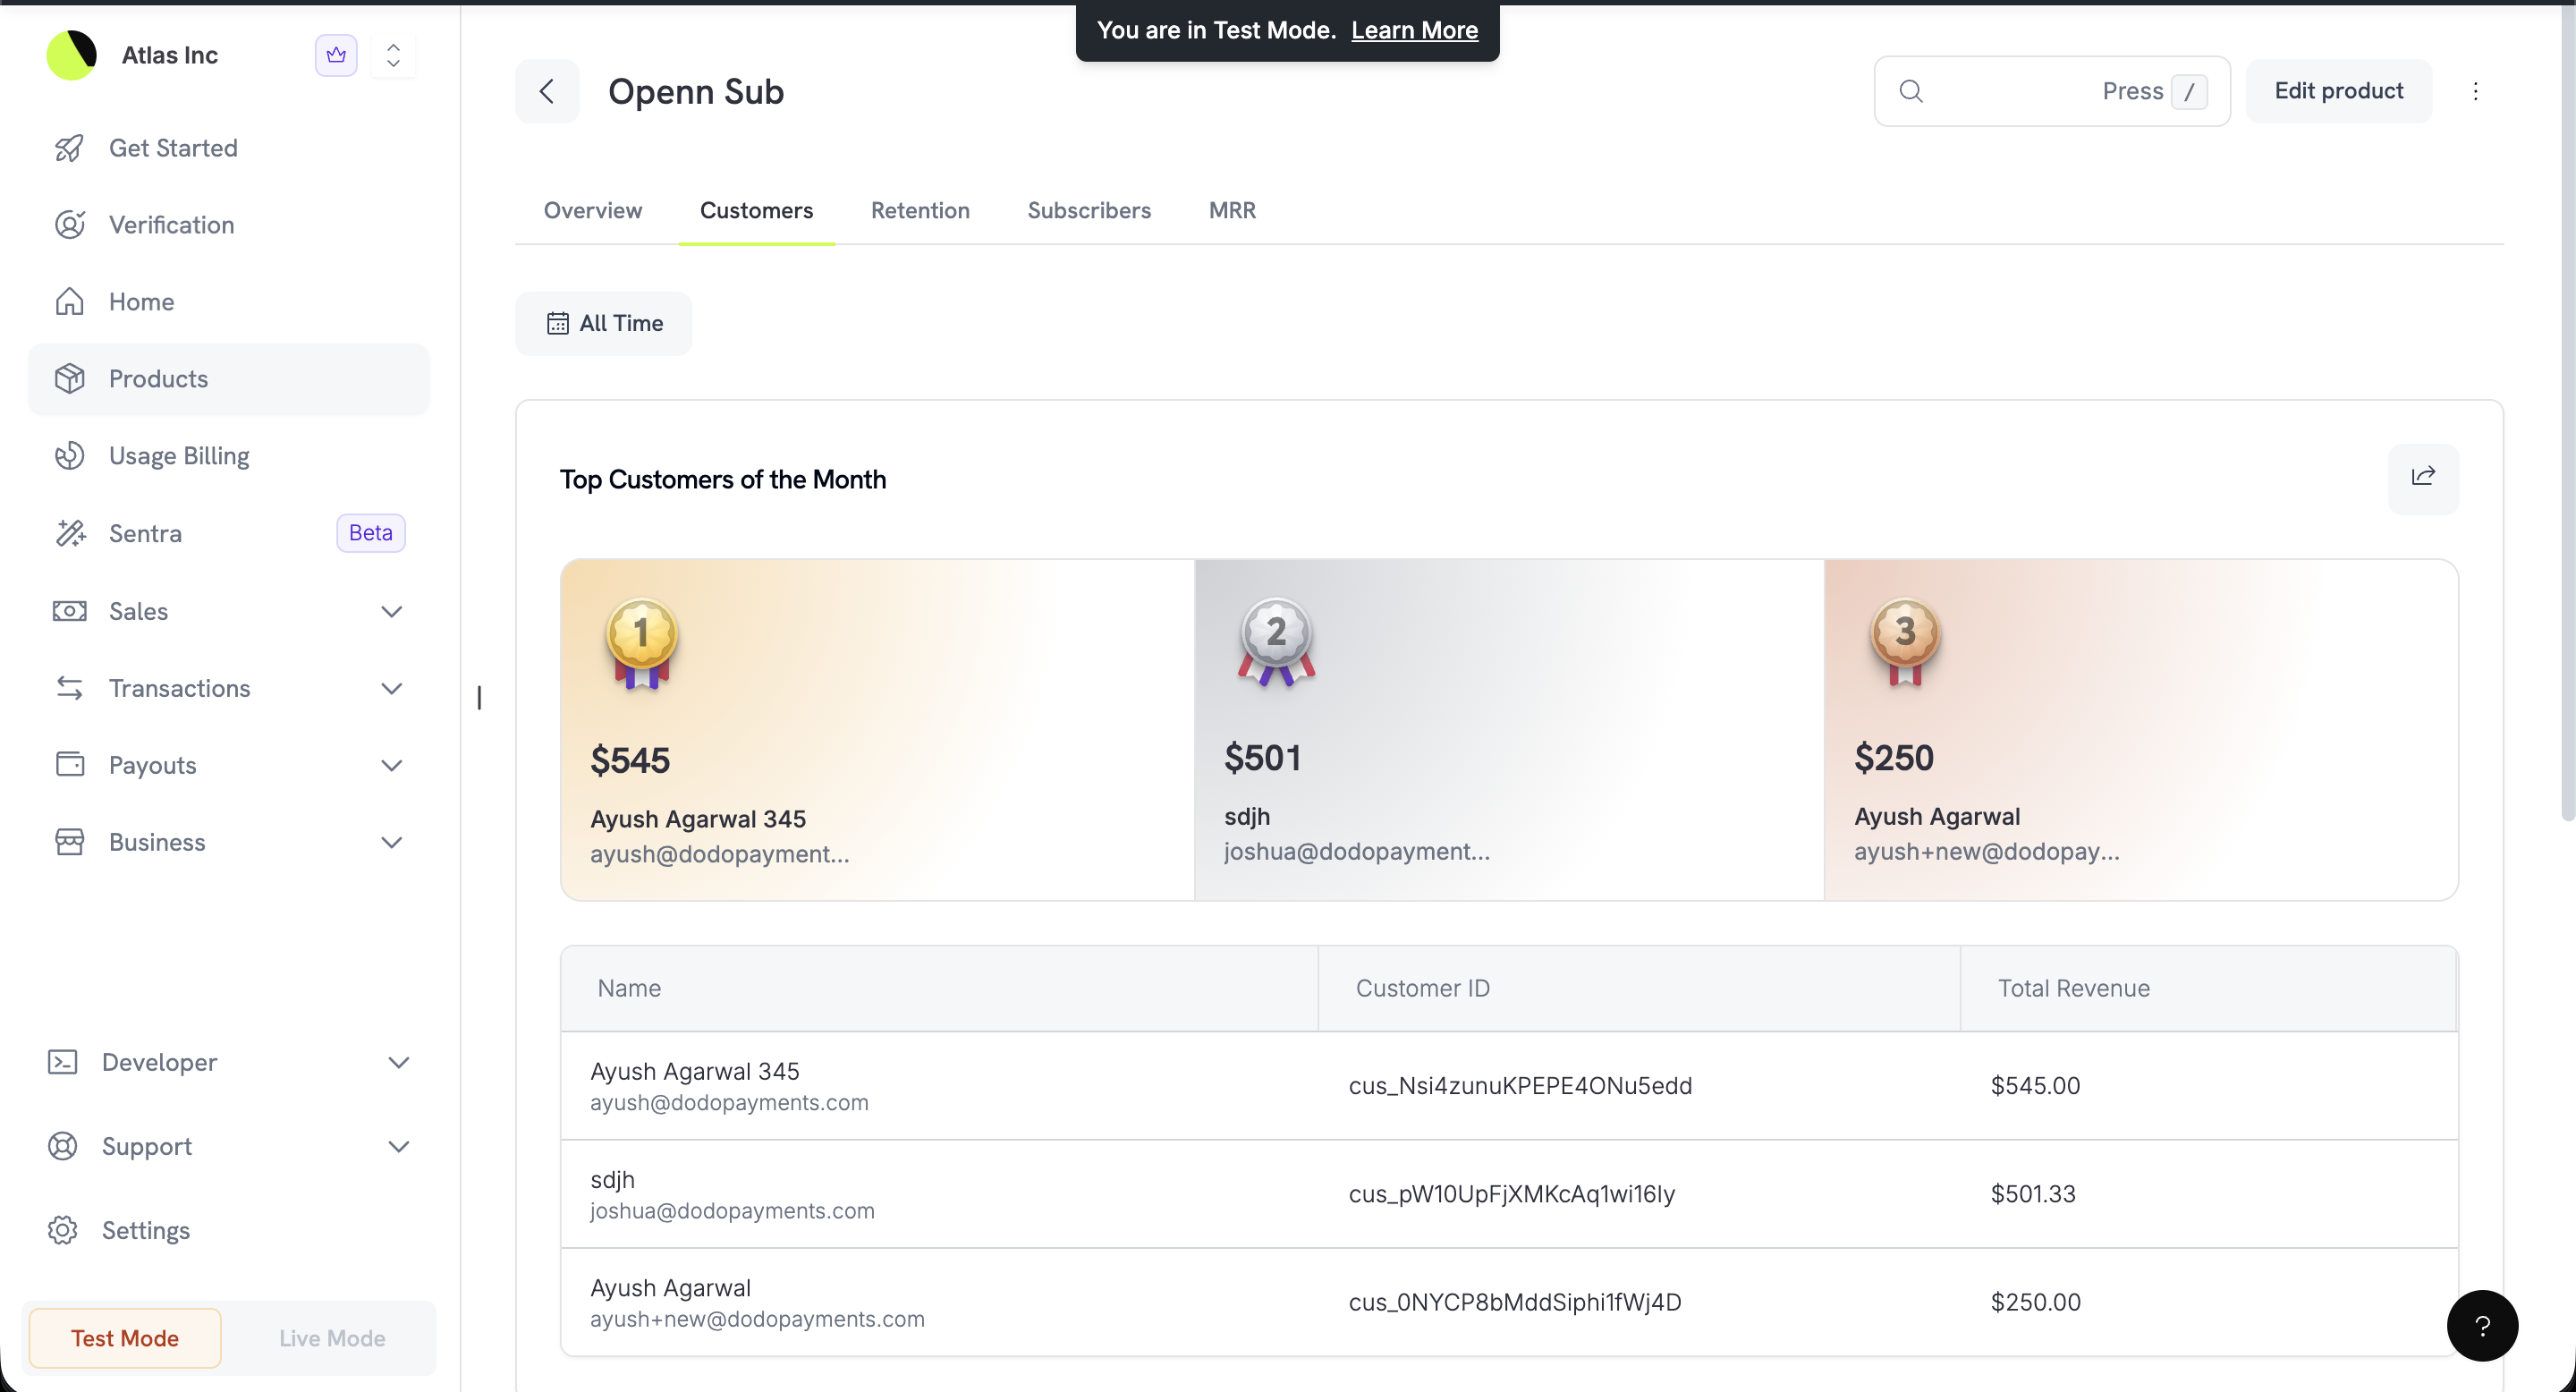
Top customers of the month with podium ranking and customer table
- Top Customers of the Month: A visual podium highlights your top 3 customers ranked by total spend, showing revenue amount, name, and email.
- Customer Table: A detailed breakdown of all customers with their Customer ID and total revenue for this product.
Retention Tab
Understand how well this product retains its subscribers.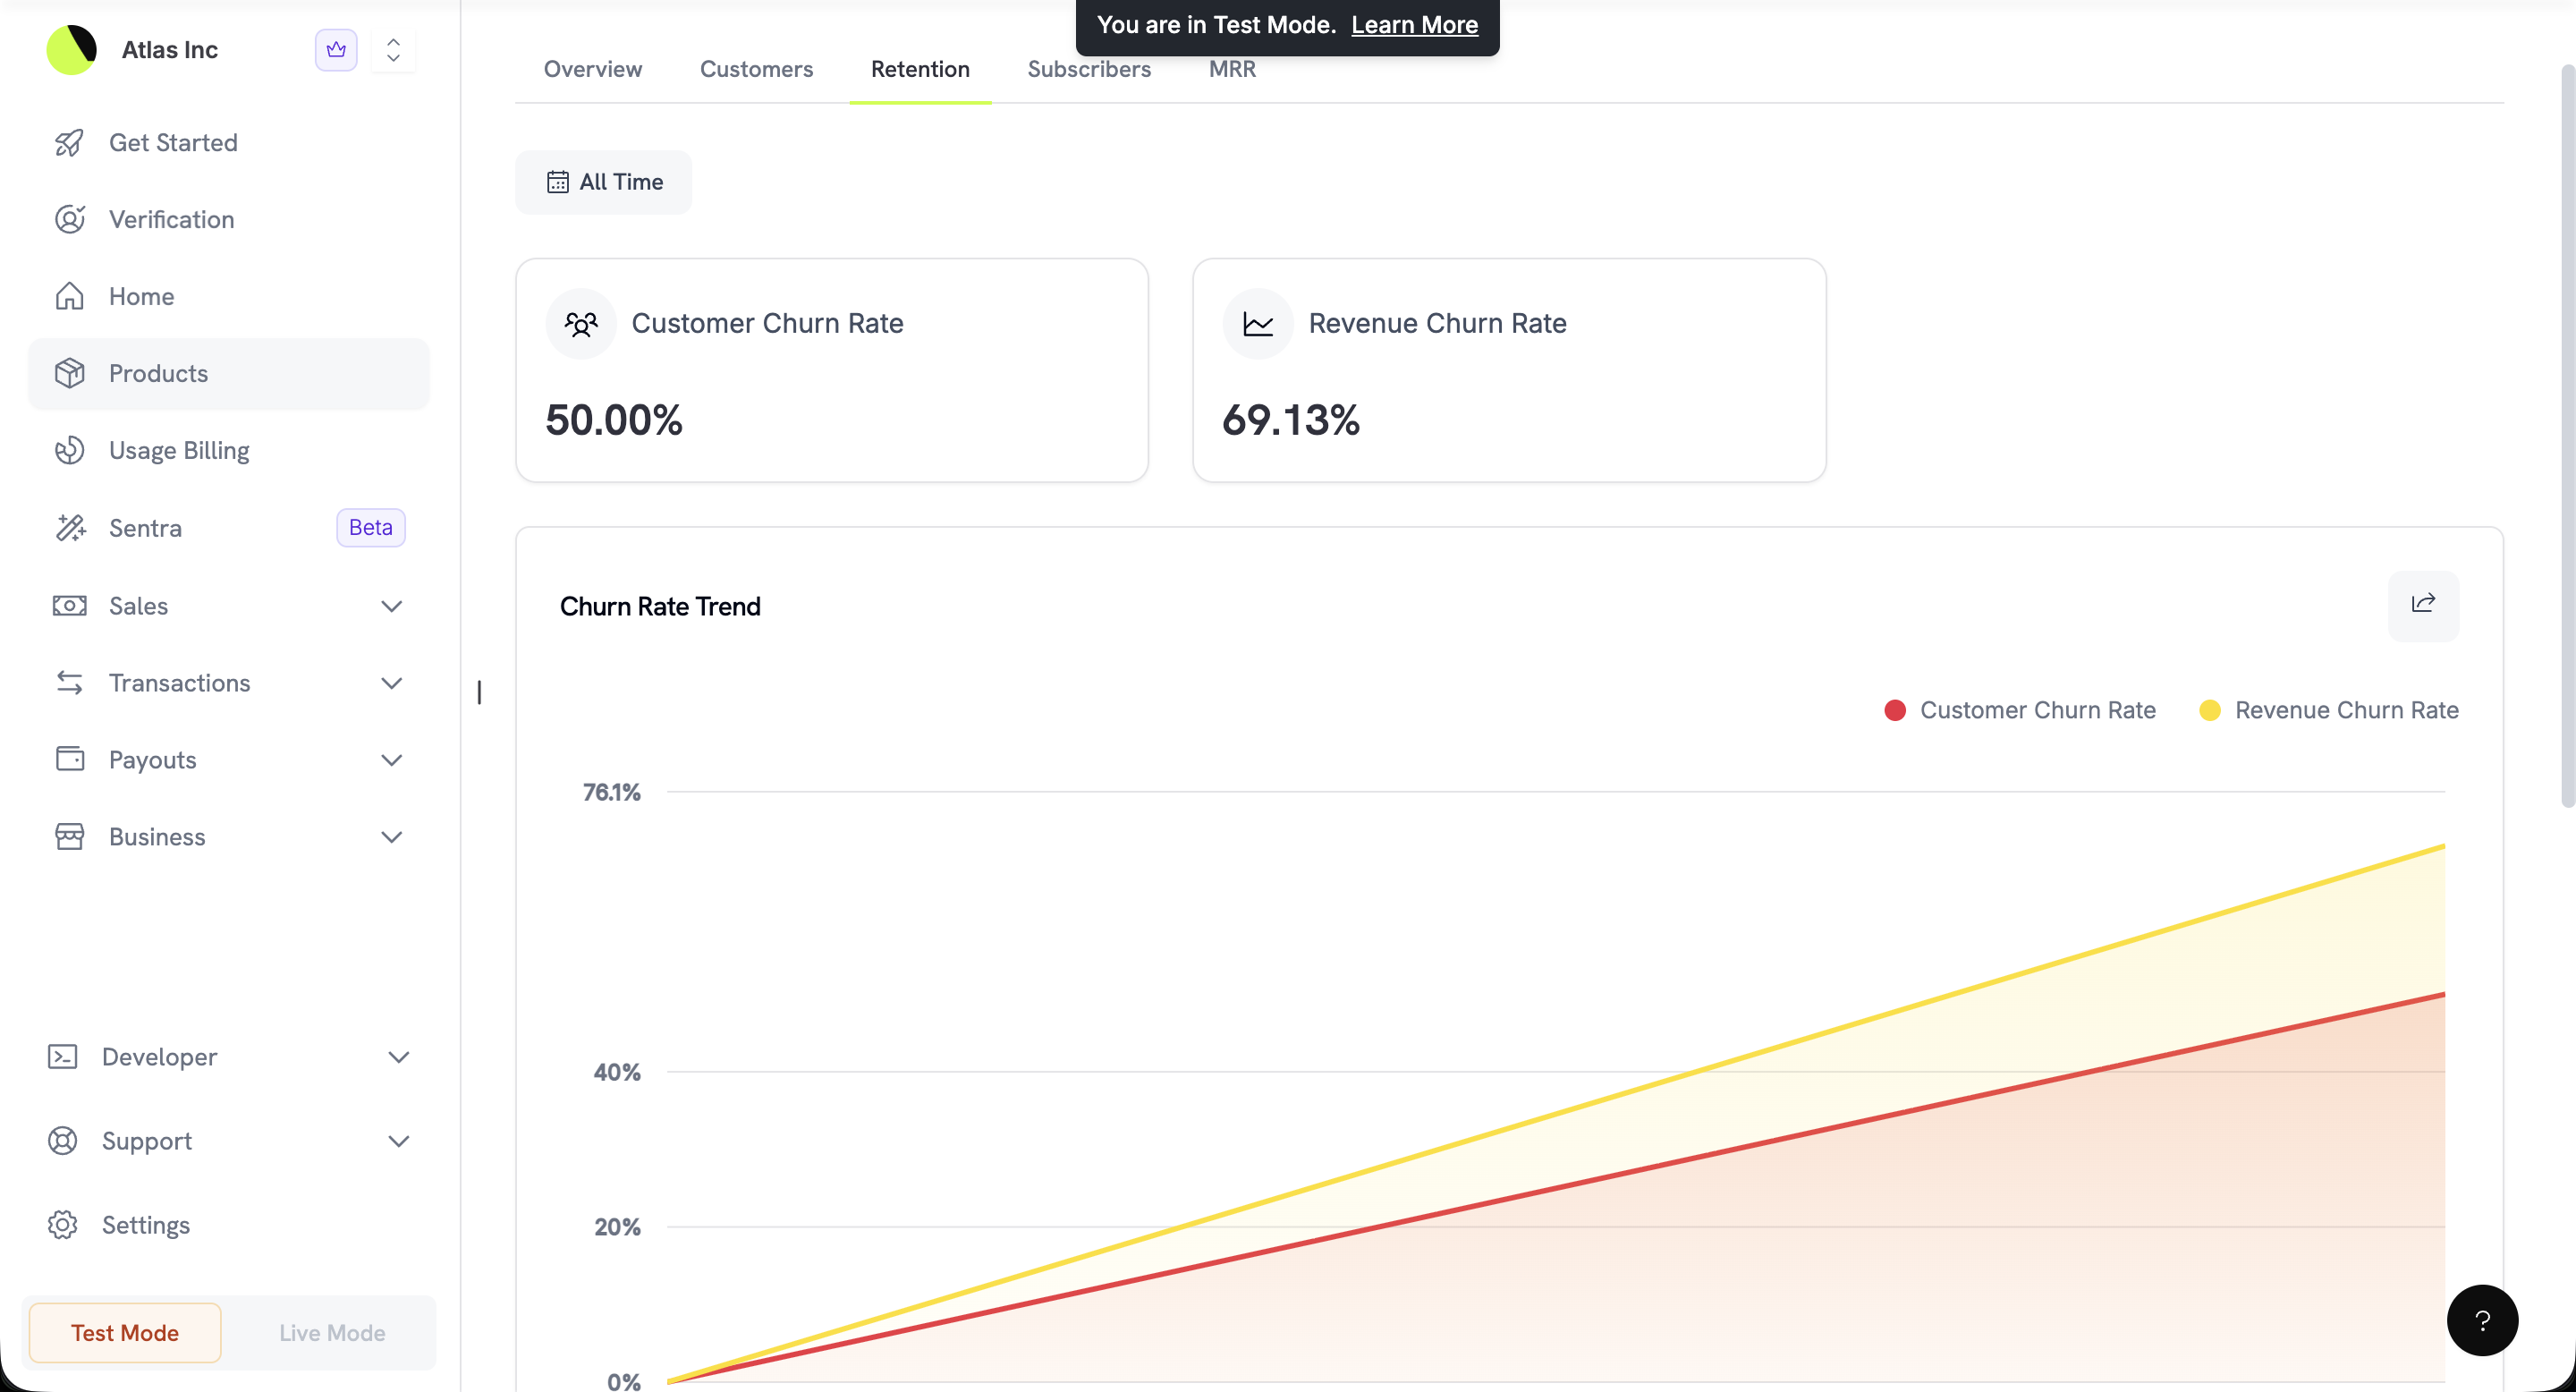
Customer and revenue churn rates with trend analysis
- Customer Churn Rate: Percentage of subscribers who have cancelled.
- Revenue Churn Rate: Percentage of revenue lost from cancellations and downgrades.
- Churn Rate Trend: A dual-line chart tracking both metrics over time to help you spot trends and take corrective action.
Subscribers Tab
A complete list of all subscriptions associated with this product.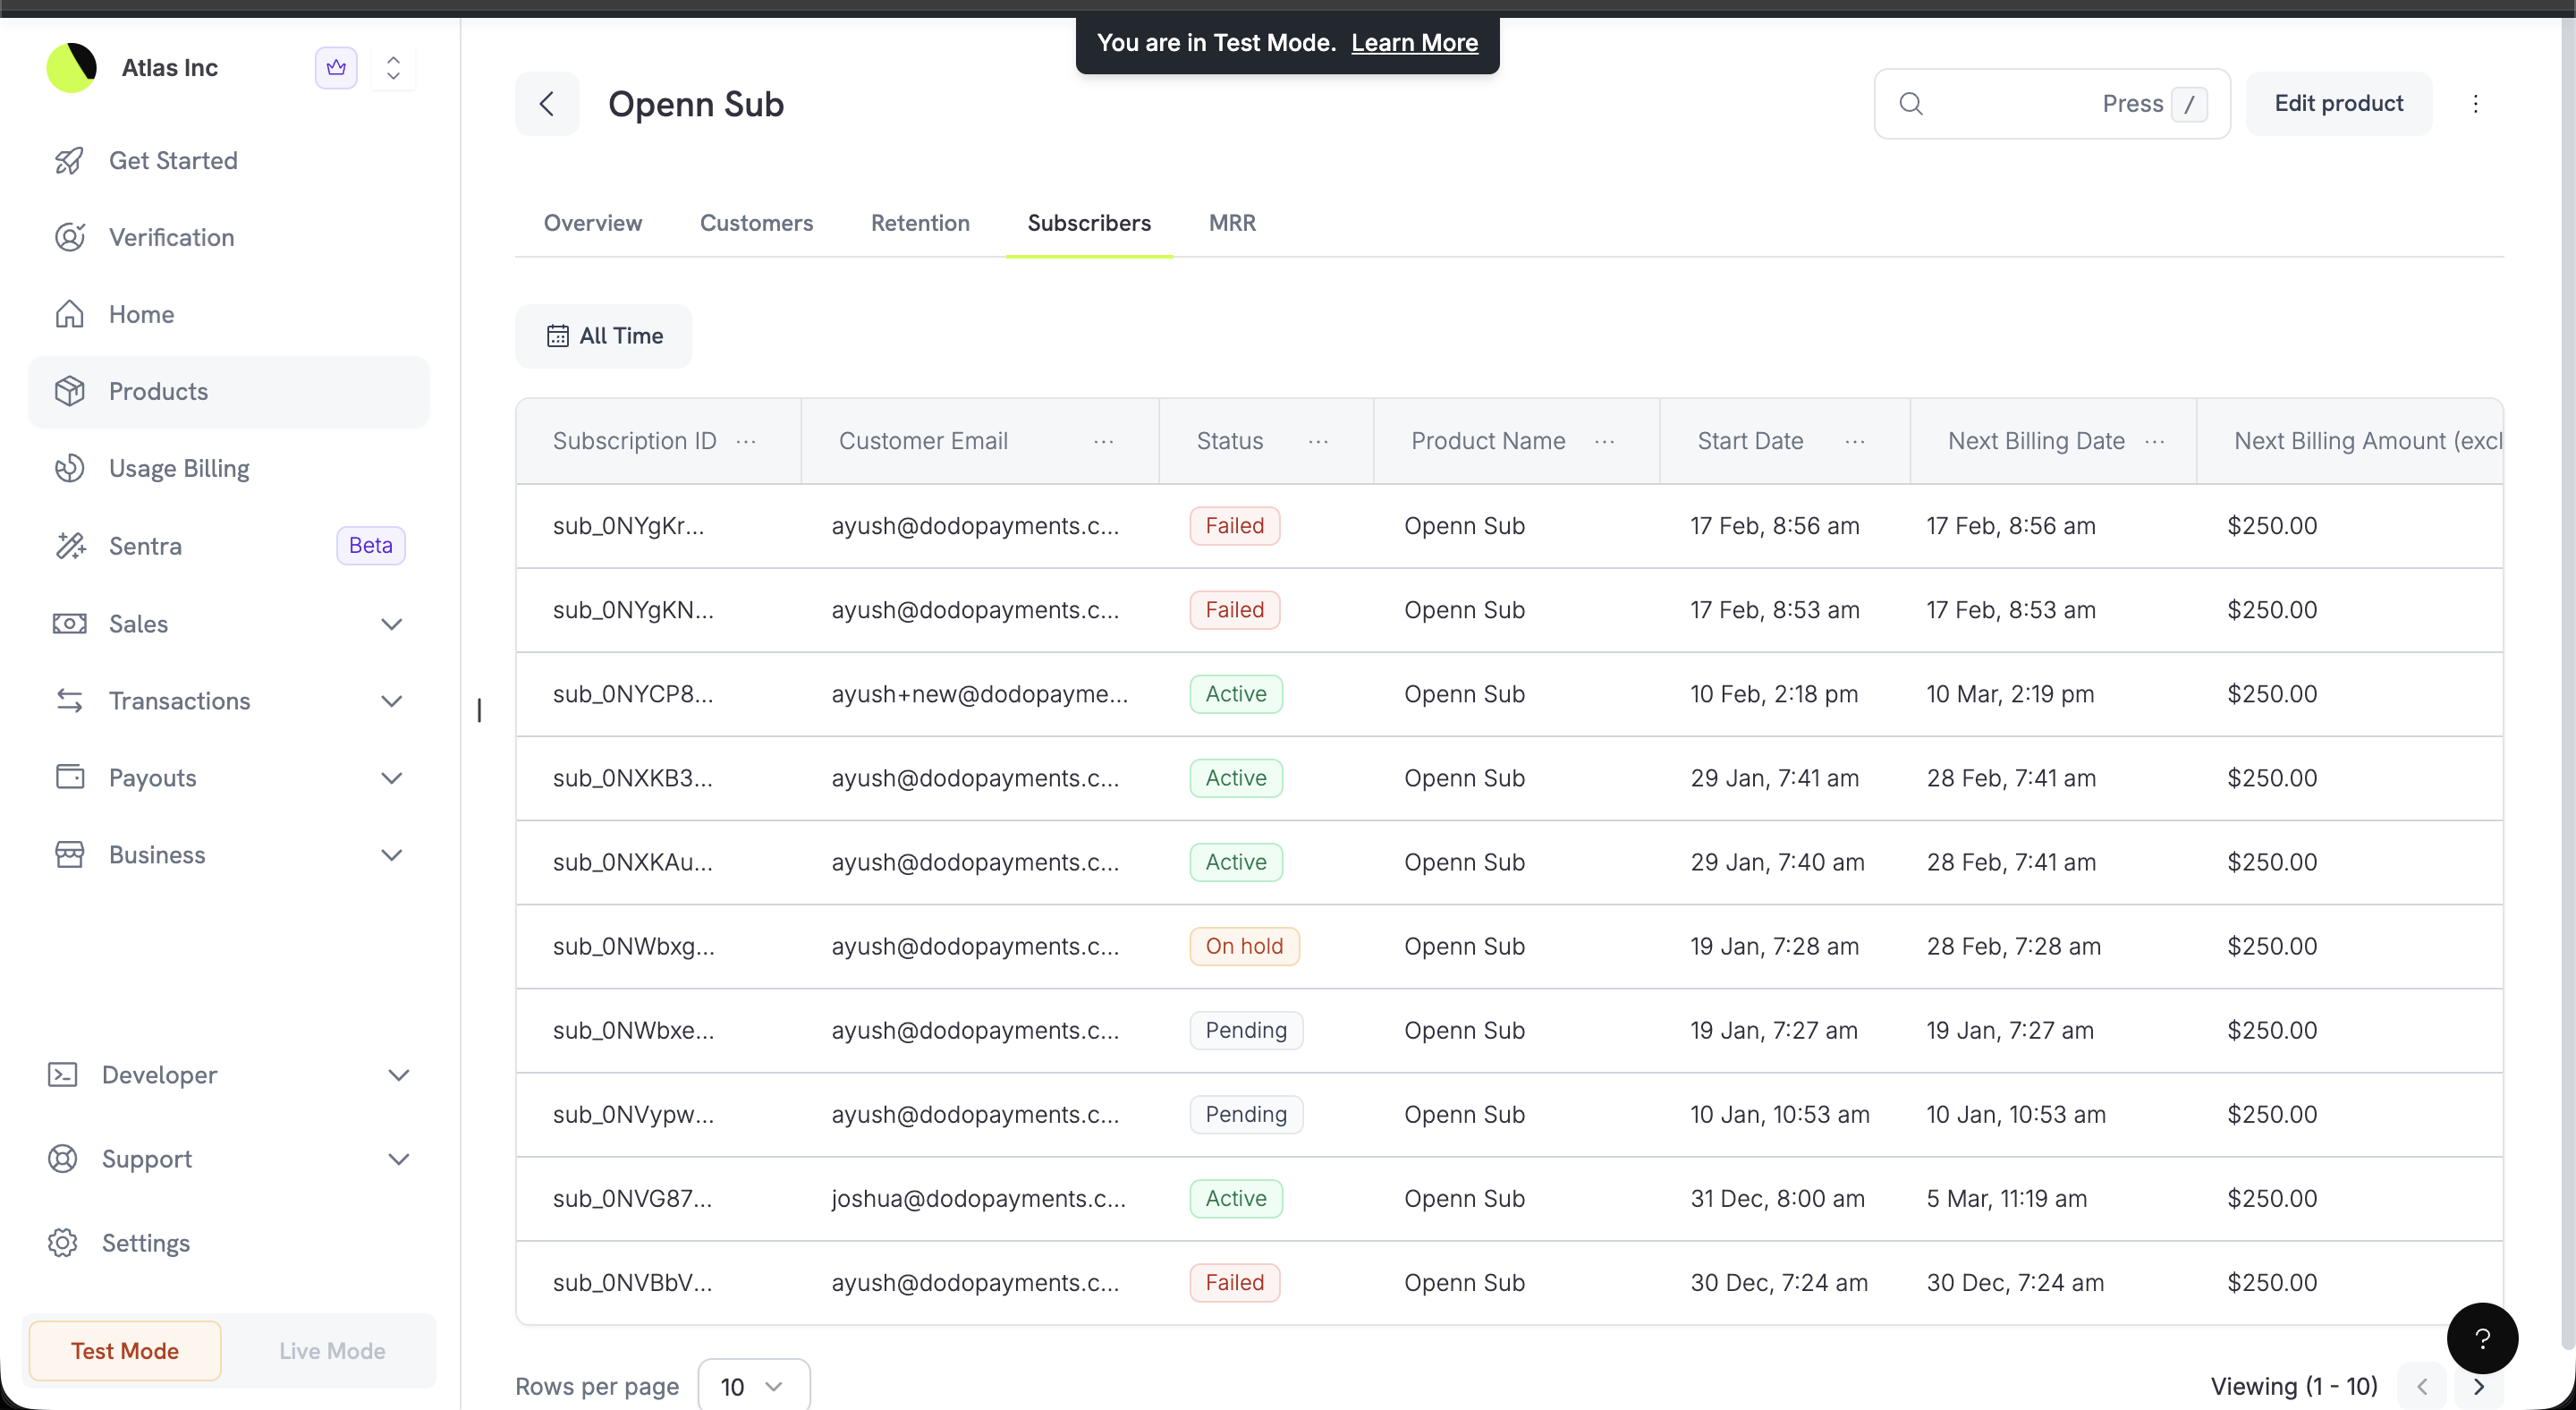
Subscribers table showing all subscriptions with statuses and billing details
MRR Tab
A detailed breakdown of your product’s Monthly Recurring Revenue.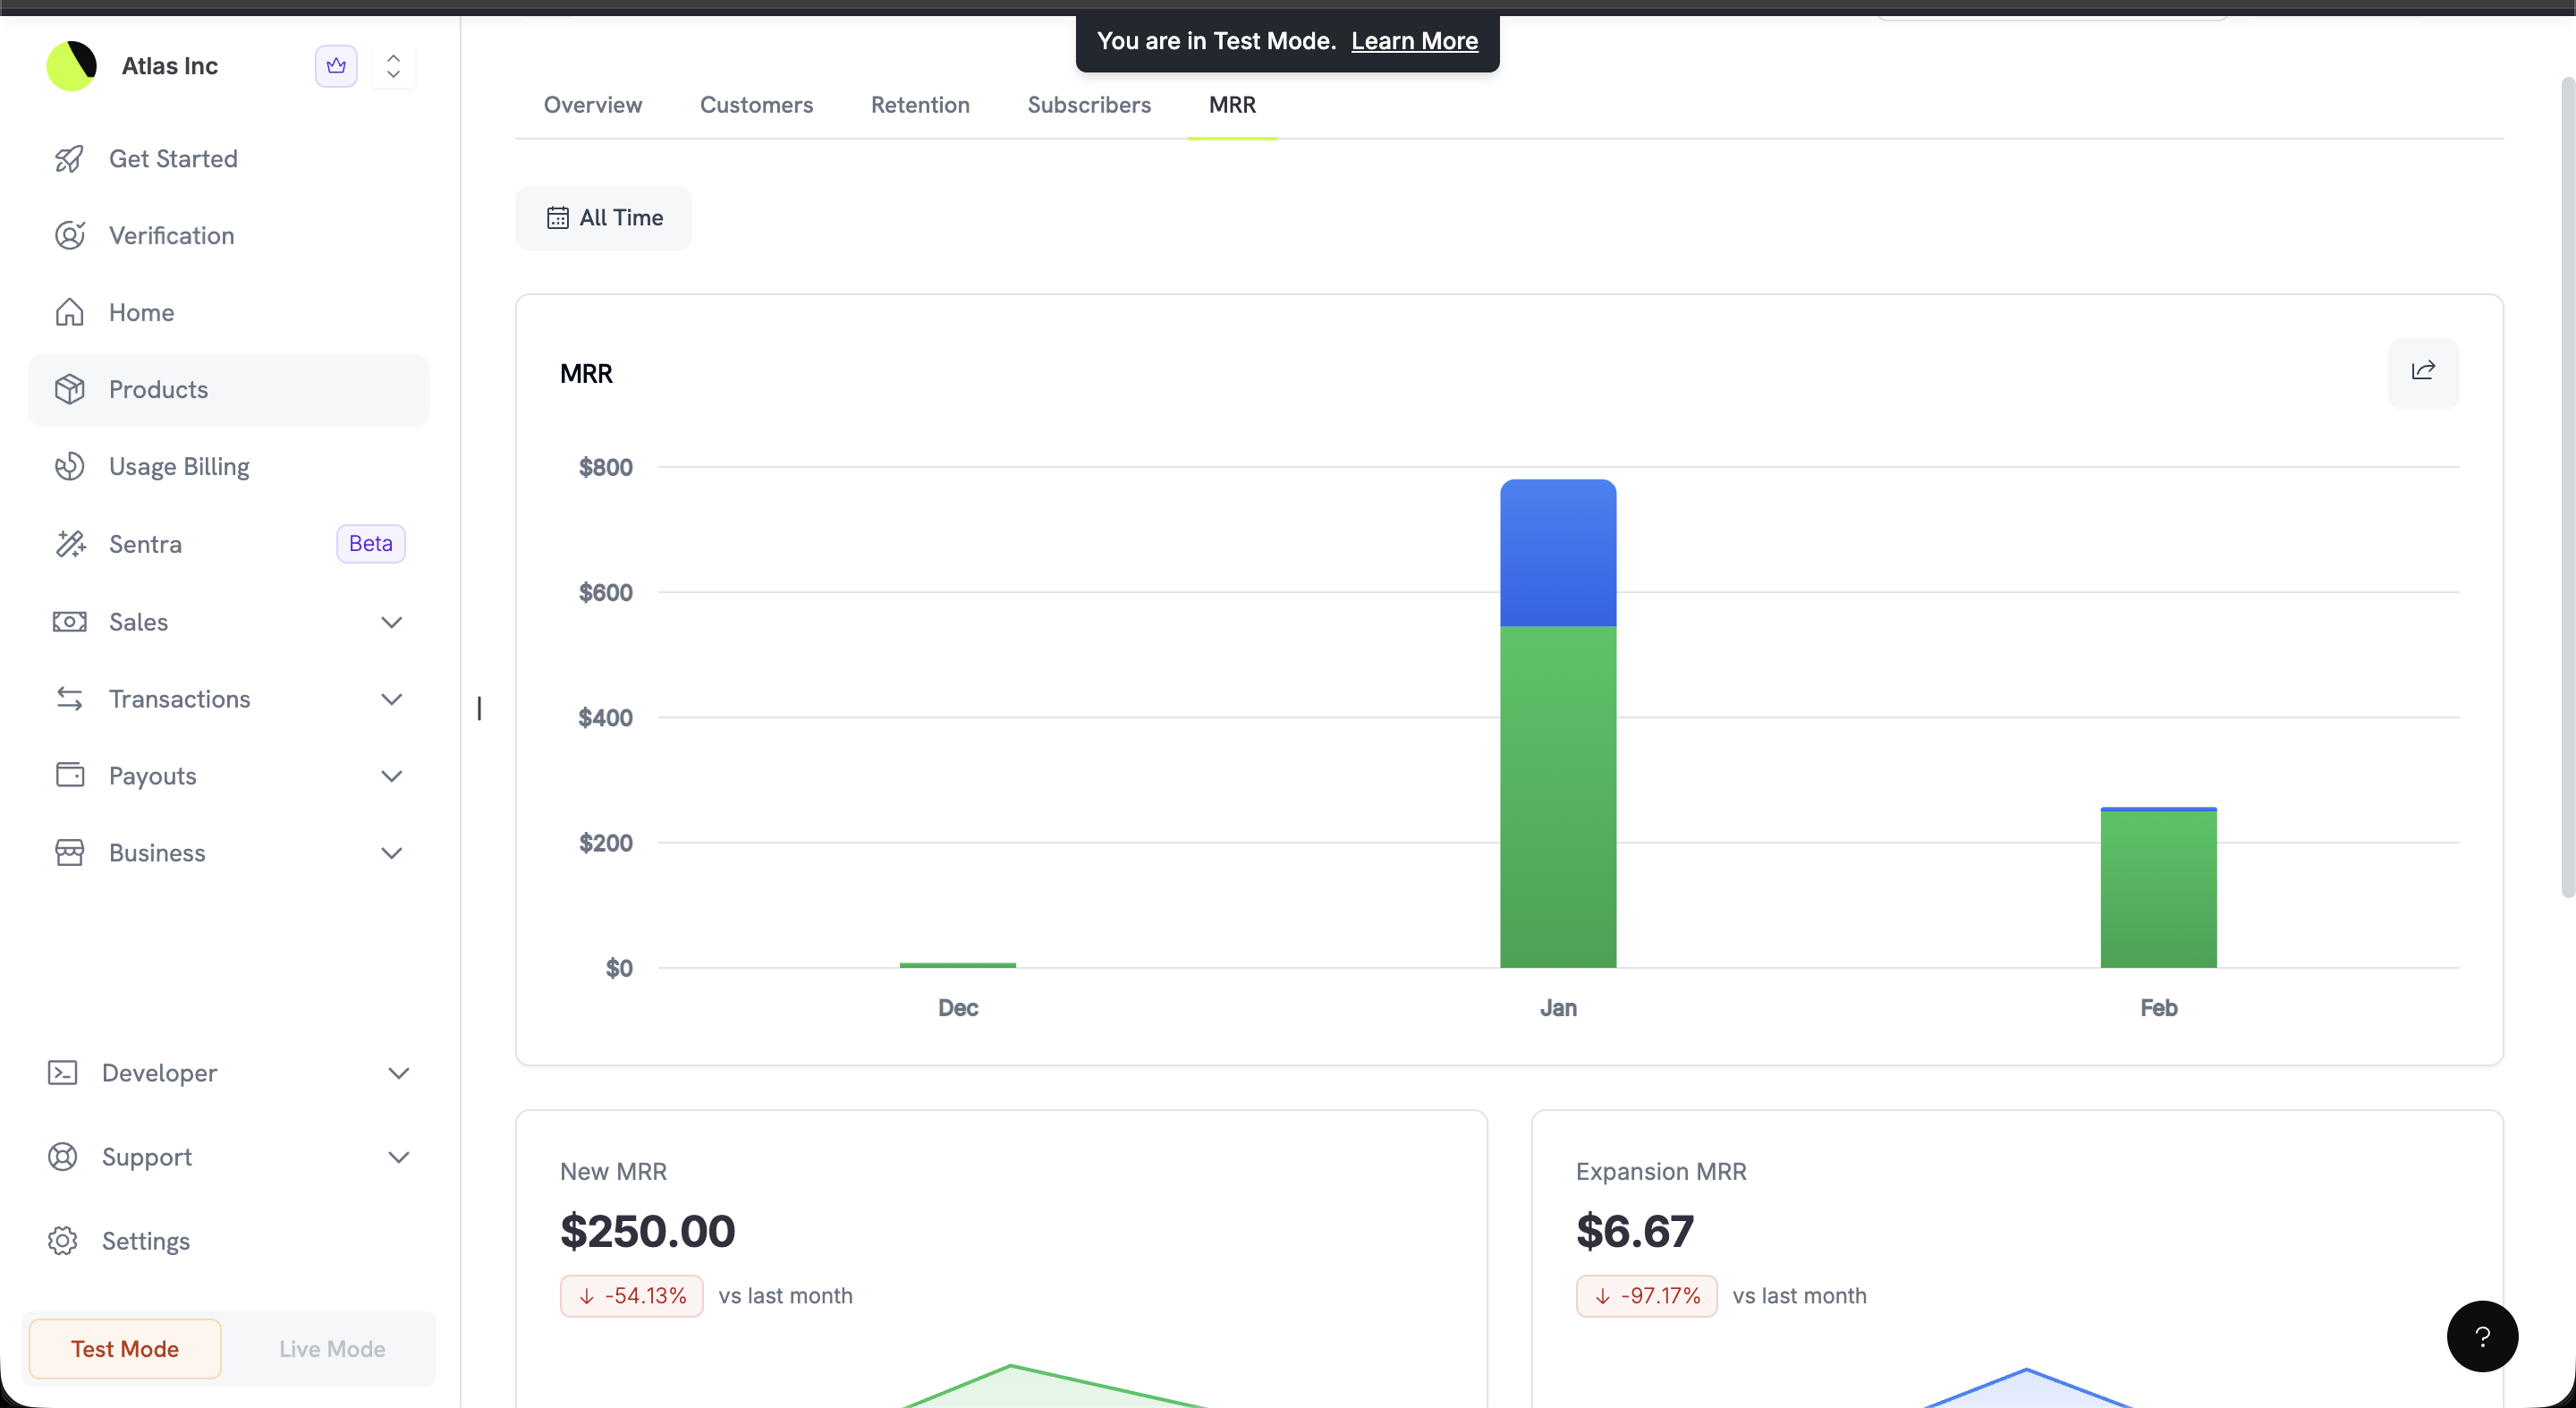
MRR stacked bar chart showing monthly revenue composition
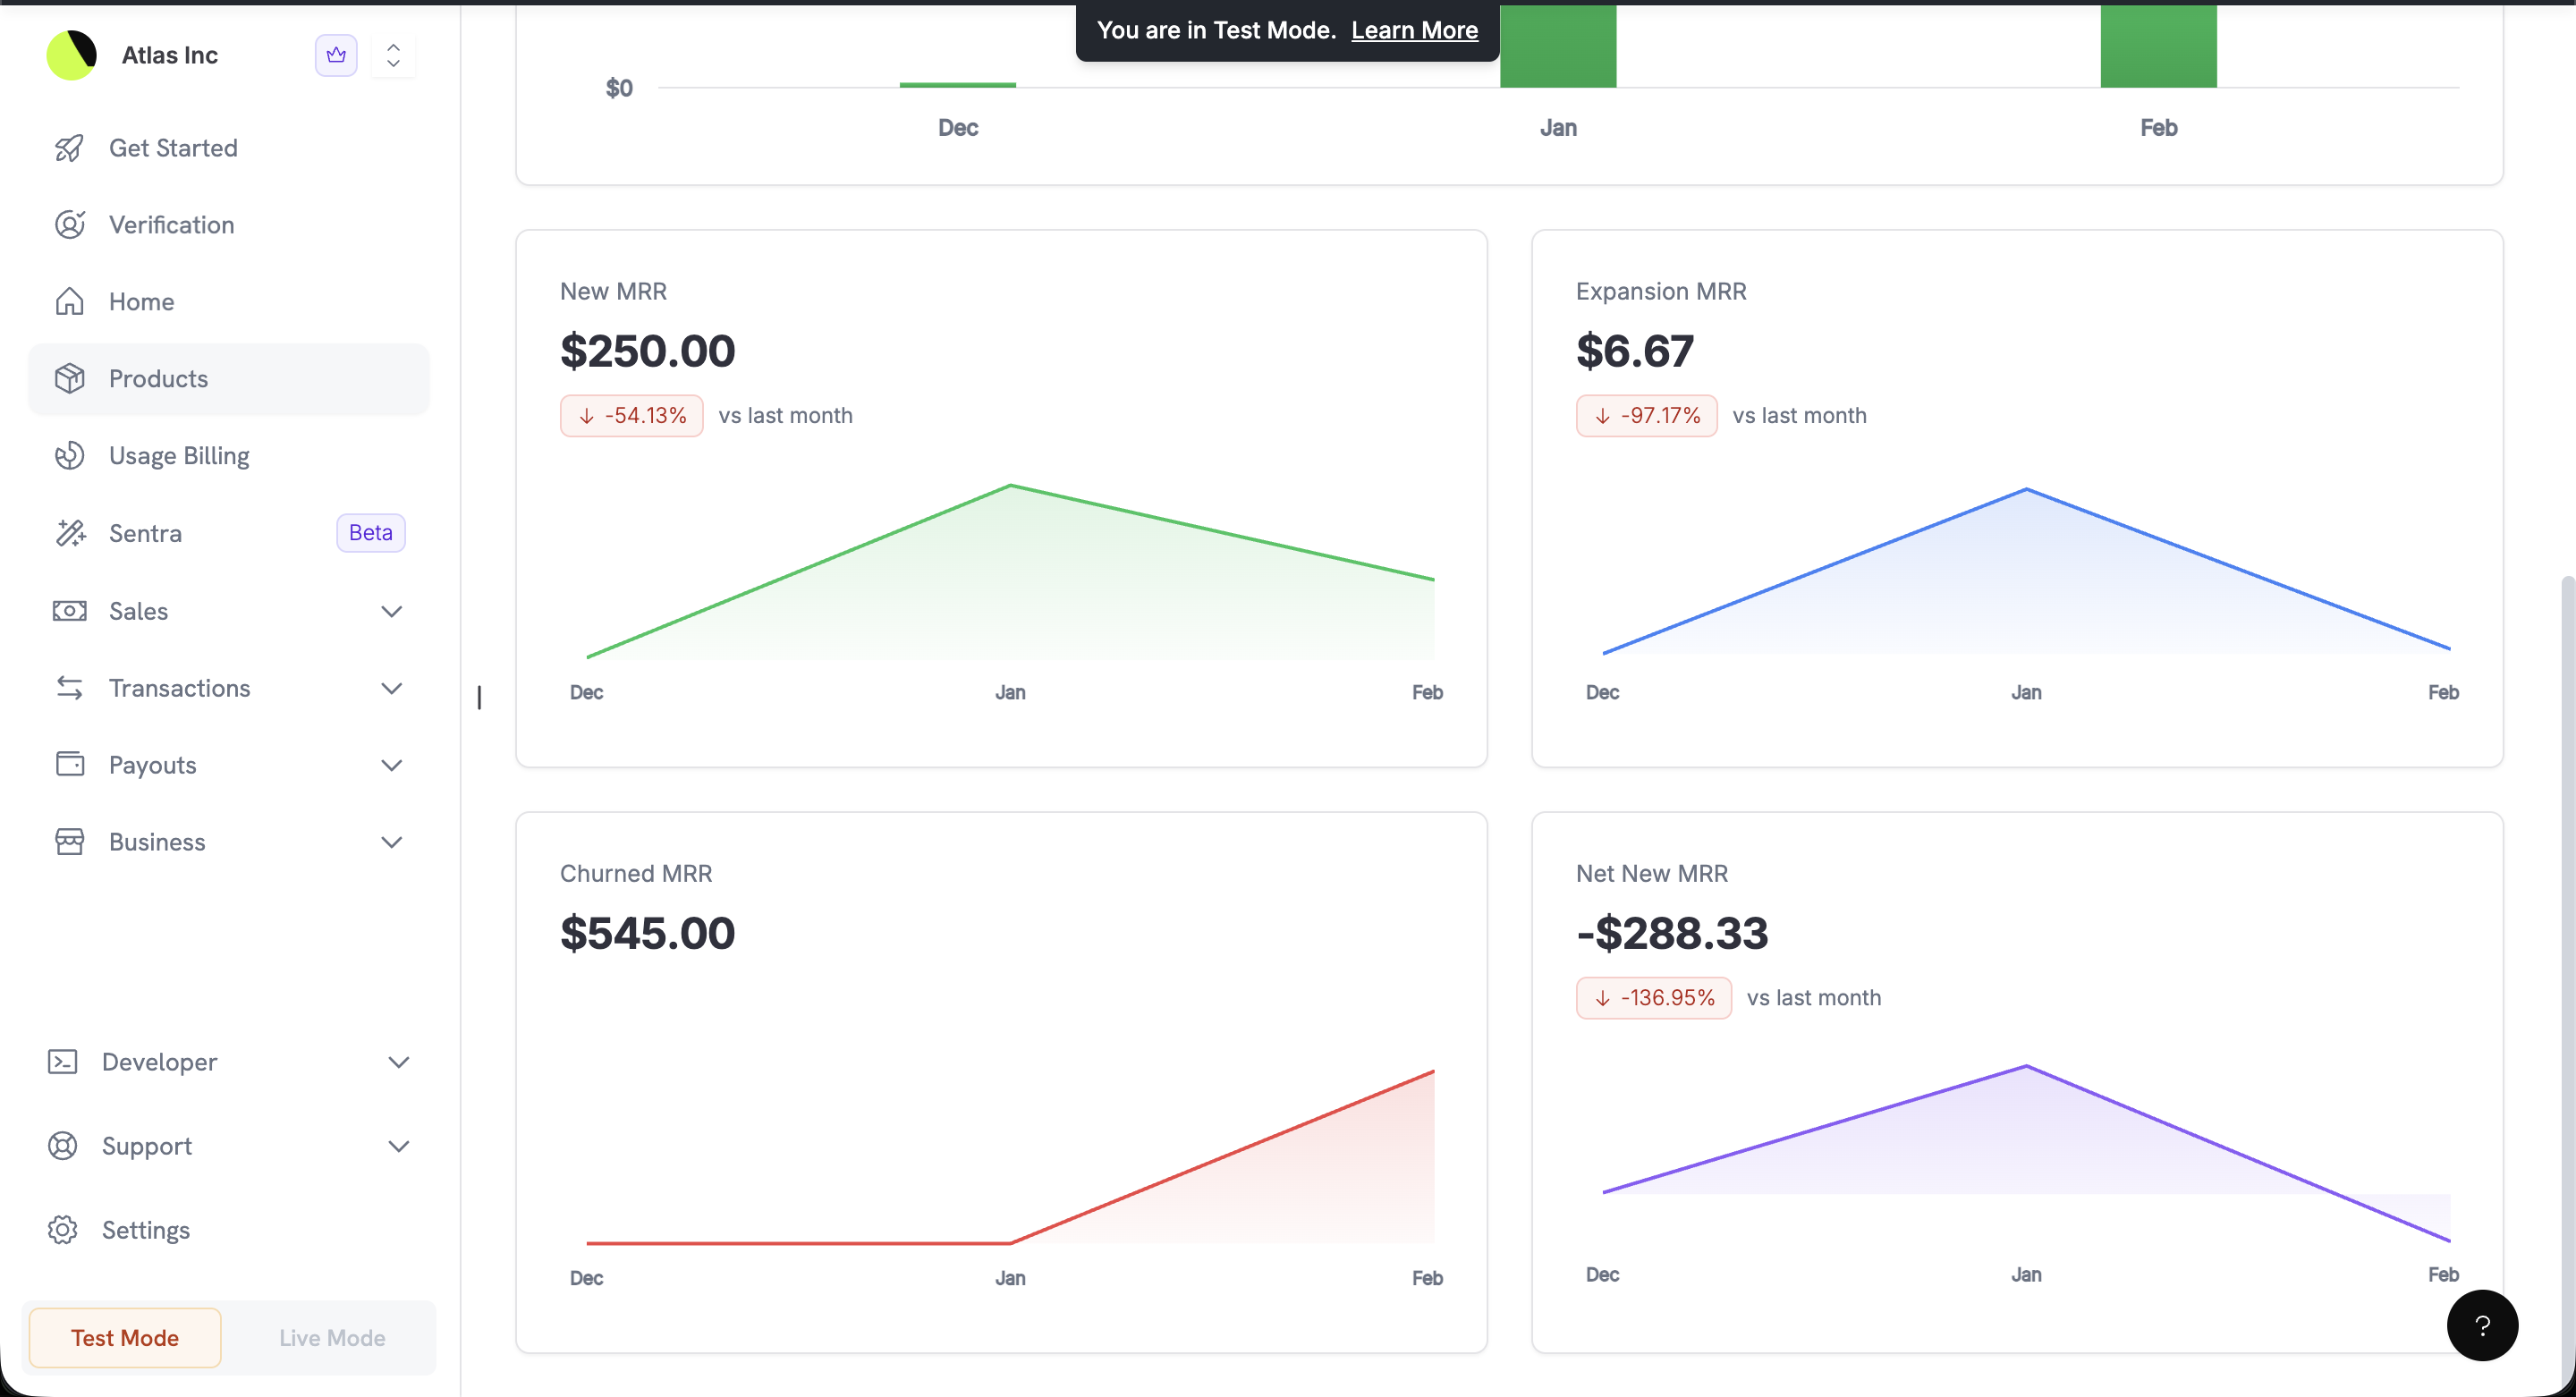
Detailed MRR breakdown with New, Expansion, Churned, and Net New MRR
Page Highlight Tiles
Many list pages in your dashboard now display highlight tiles at the top, giving you key summary metrics at a glance—without opening the full Analytics dashboard. The tiles respect the page’s active filters.Reports
Each report has a Build Report button on its respective page. Navigate to the relevant section to access and download the report you need. Each report can be filtered (by payment method, status, product type, failure type, dispute status, or currency where applicable) and downloaded as a CSV.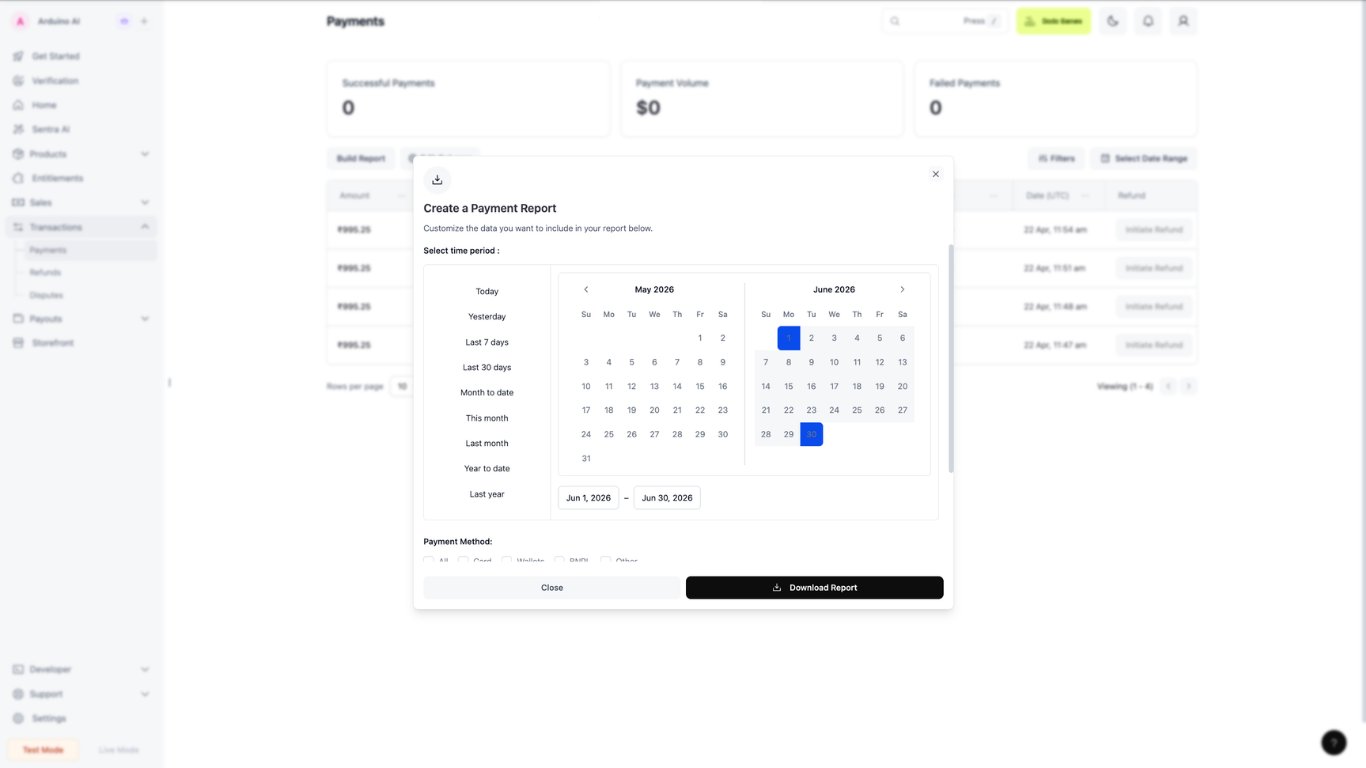
Create a Payment Report with time period and filter options
Downloading Reports
Navigate to the relevant page
Select a time period
Download