Analytics and Reporting dashboard overview

परिचय

Dodo Payments का Analytics & Reporting आपको व्यावसायिक प्रदर्शन पर नज़र रखने, ग्राहक व्यवहार समझने और डेटा-आधारित निर्णय लेने में मदद करता है। Home एक चयनित, एक-नज़र में दिखने वाला सार है; Analytics गहन, फ़िल्टर किए जा सकने वाले विश्लेषण के लिए है।

Home

दैनिक स्थिति (Today) और अनुकूलन योग्य अवलोकन।

Business Analytics

आपके पूरे व्यवसाय में राजस्व, ग्राहक, subscriptions, retention, transaction health और recovery।

Product-Level Analytics

अलग-अलग product performance—राजस्व, ग्राहक, churn, subscribers और MRR—का गहन विश्लेषण करें।

Page Highlight Tiles

अपने products, subscriptions, payments और अन्य list pages पर मुख्य metrics का एक-नज़र में सार।

Exportable Reports

कस्टम date ranges के लिए payments, refunds, payouts, disputes और अन्य डेटा को CSV के रूप में डाउनलोड करें।
Dashboard Analytics Home page showing the Today pulse and a customizable overview of key business metrics

The Home dashboard: a daily pulse plus a customizable overview


Home

Home sidebar में आपका landing page है, जिसमें दो भाग हैं: Today और Your overview

Today

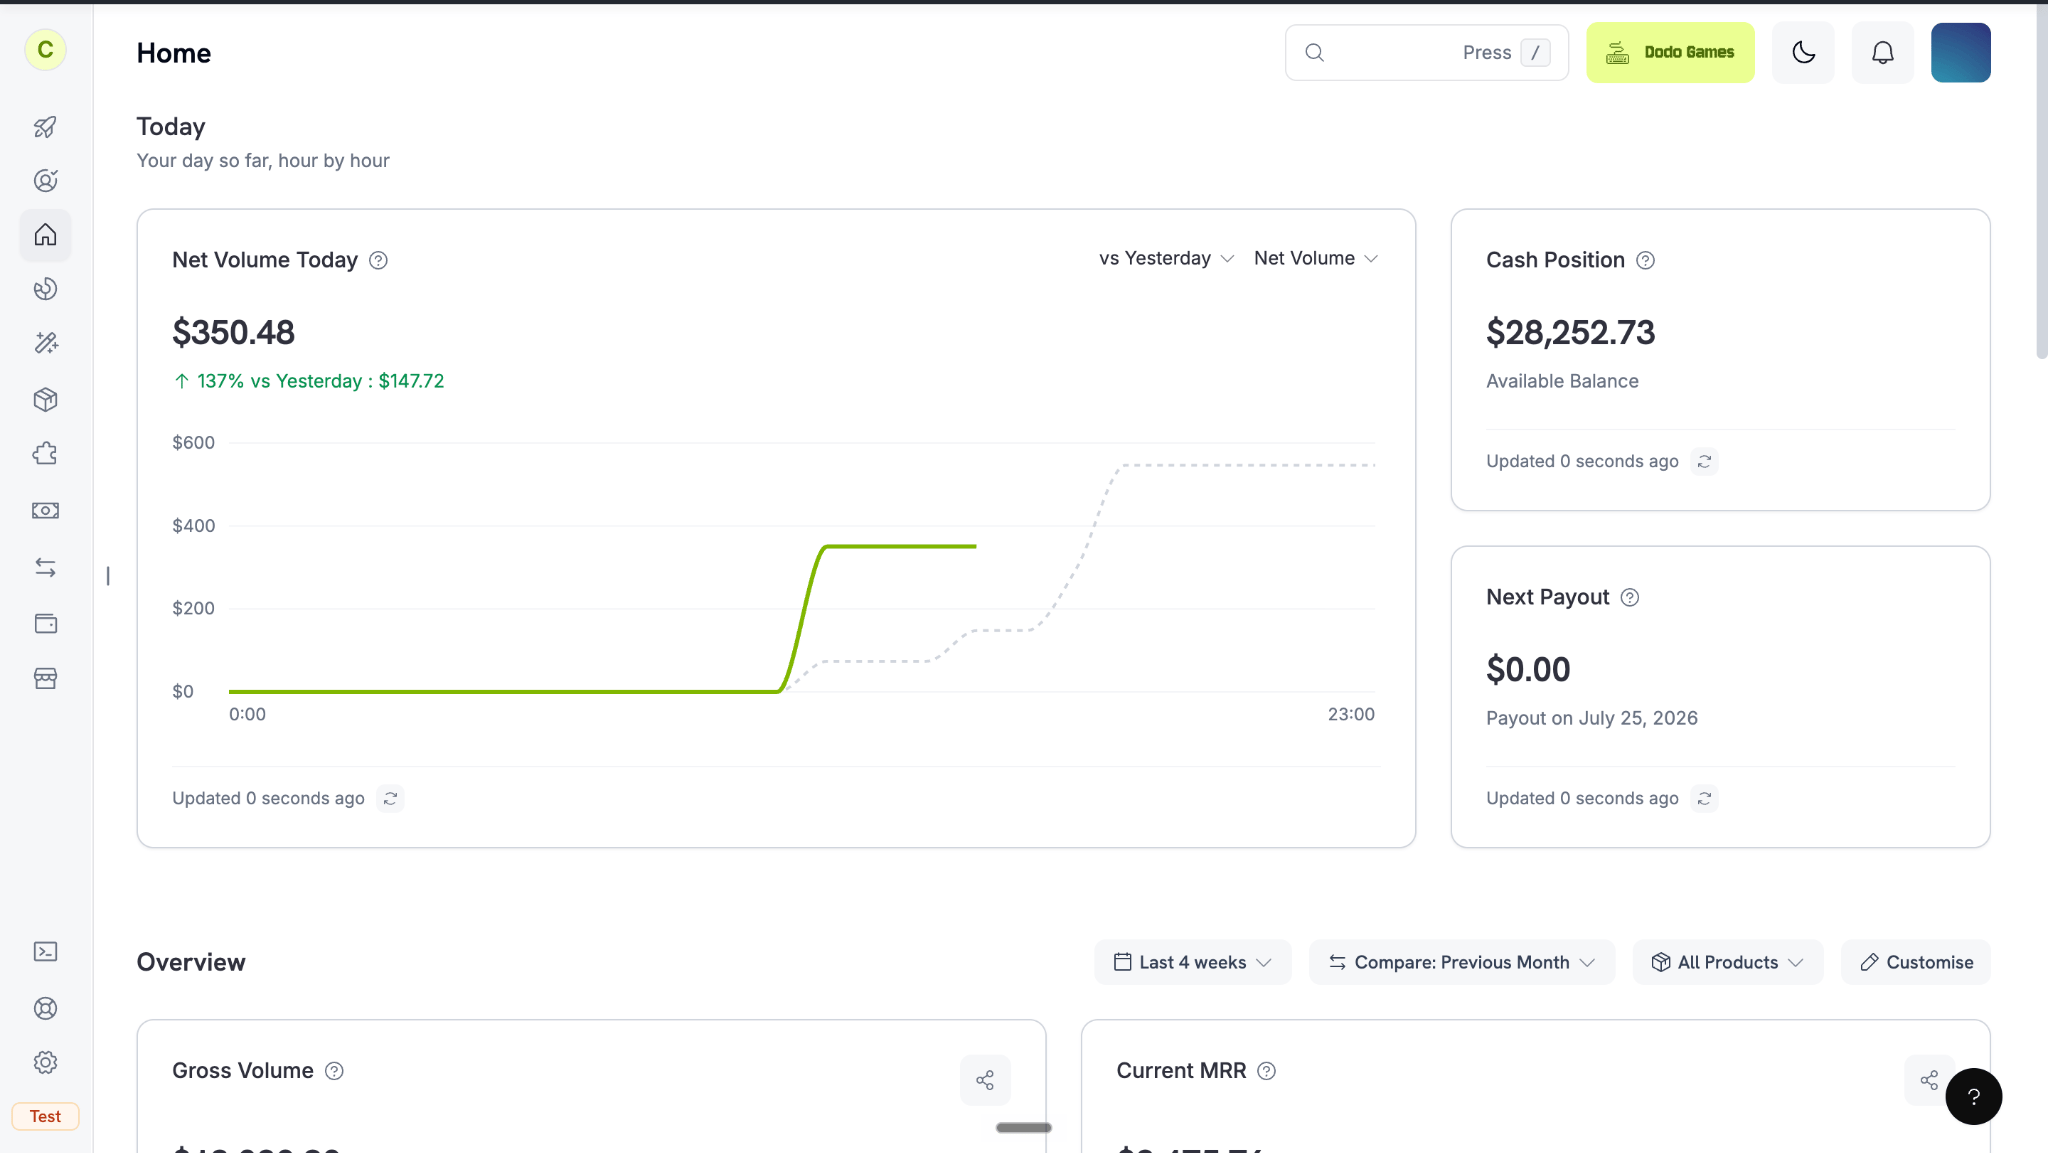
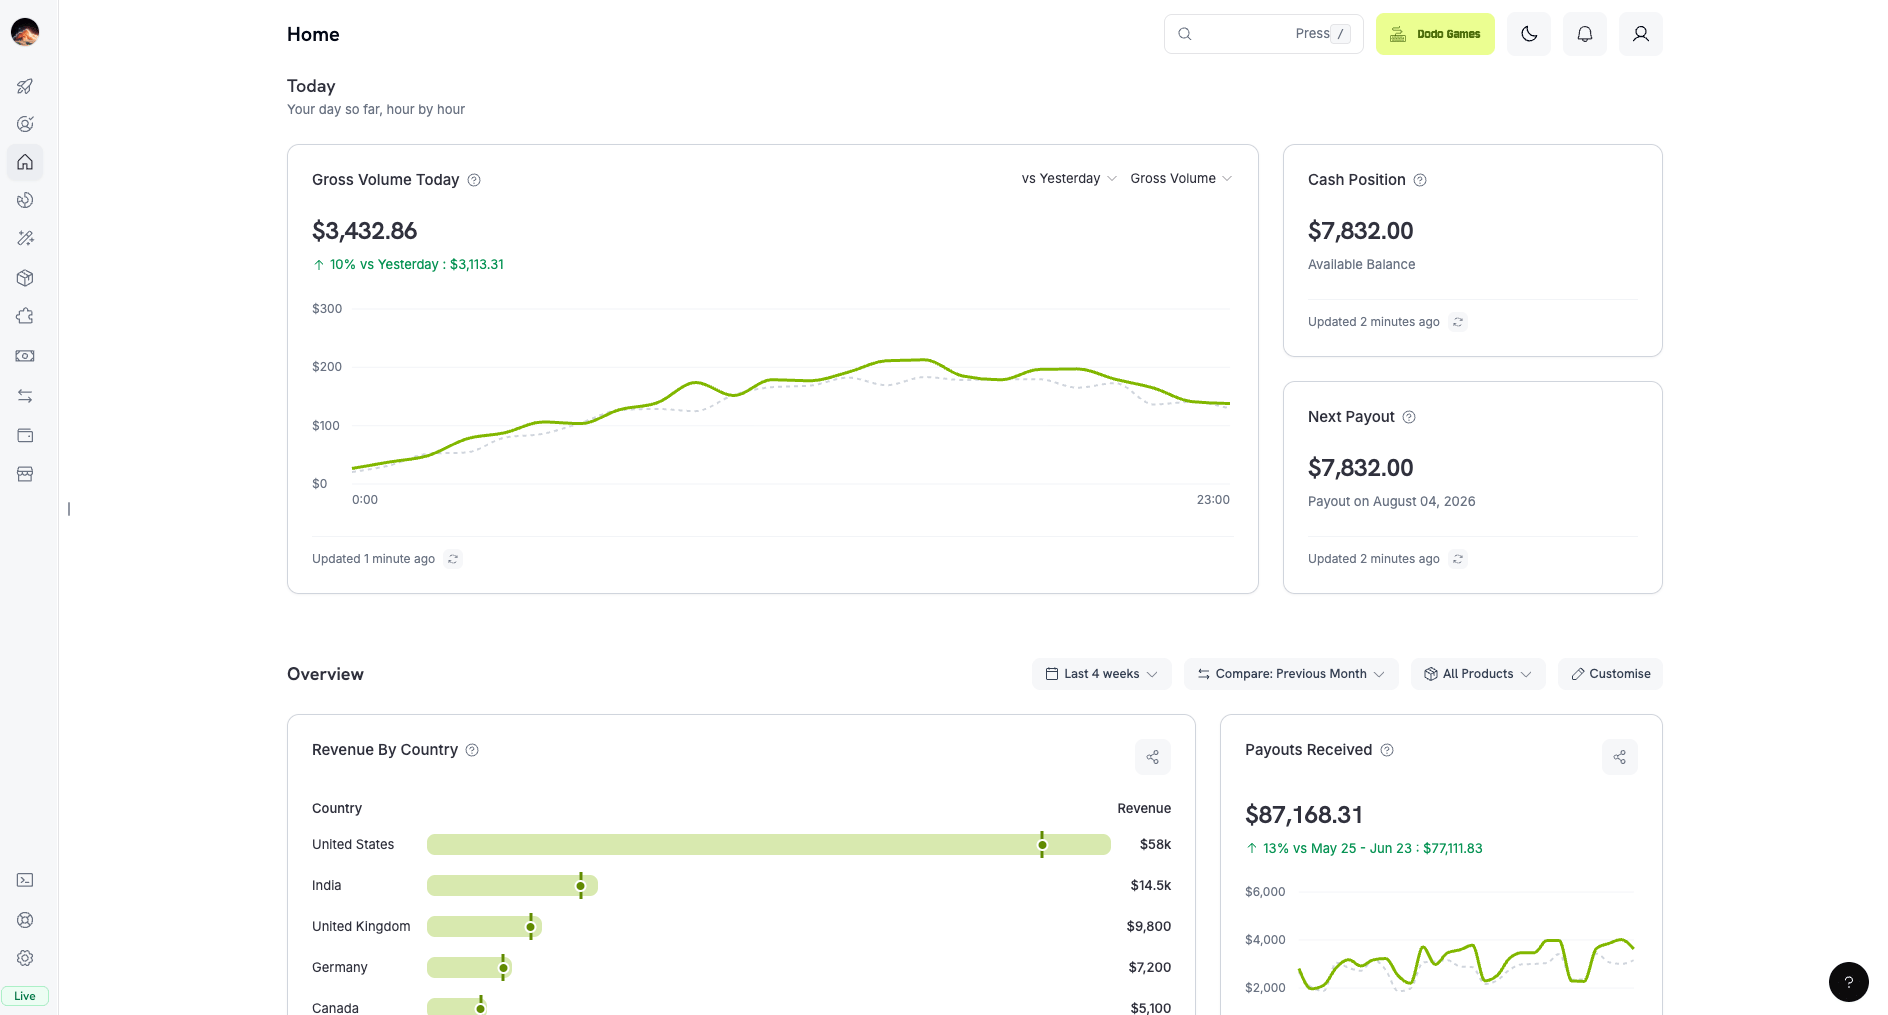
Home Today view with an hourly volume chart, cash position, and next payout tiles

Today: your day's pulse, hour by hour

दिन की स्थिति, घंटे-दर-घंटे।
  • Headline chart: Net volume और Gross volume के बीच बदलें (डिफ़ॉल्ट रूप से Net volume), जिसे कल के इसी समय की line के मुकाबले घंटेवार दिखाया जाता है।
  • Cash Position: आपका वर्तमान wallet balance और अगली payout date।
दोनों cards में info tooltip (ⓘ) और “Updated Xs ago” timestamp होता है, ताकि आपको हमेशा पता रहे कि data कितना नया है।

Your Overview

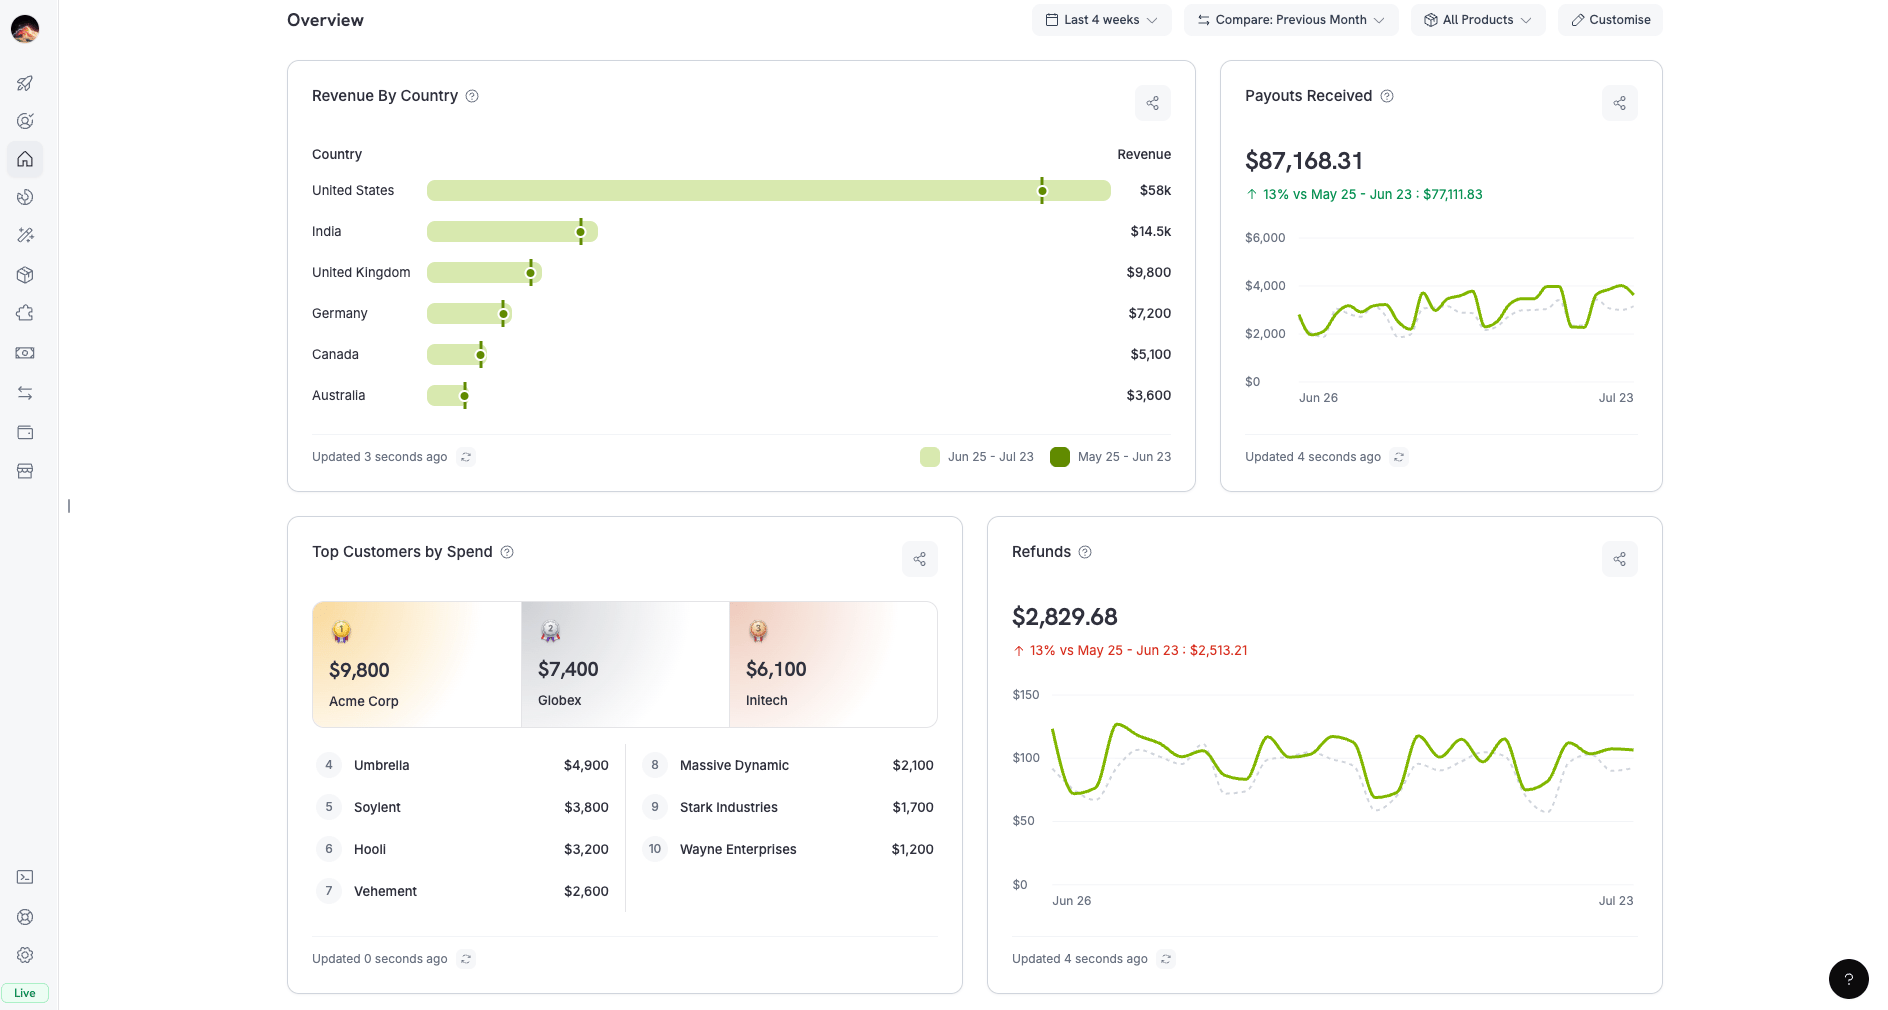
Home Your overview view with customizable cards for revenue by country, payouts received, top customers by spend, and refunds

Your overview: a fully customizable set of metric cards

पूरी तरह अनुकूलन योग्य—cards चुनने, क्रम बदलने और हटाने के लिए Customize का उपयोग करें।
  • Default cards: Net volume, Gross volume, Payments, Top customers by spend, New customers, Revenue by country और Refunds—साथ ही Average order value (one-time/usage merchants) या MRR और Net New MRR (subscription merchants)।
  • Controls:
    • Period: Daily/Weekly या कस्टम range।
    • Compare: Previous period या previous month (डिफ़ॉल्ट रूप से चालू)।
    • Product: एक product या एक group।

Analytics

अपने पूरे business का गहन विश्लेषण करने के लिए sidebar में Home के ठीक नीचे Analytics खोलें। यह छह tabs में व्यवस्थित है और प्रत्येक के अपने filters हैं।

Revenue

Gross/net volume, payouts, refunds, disputes और top markets।

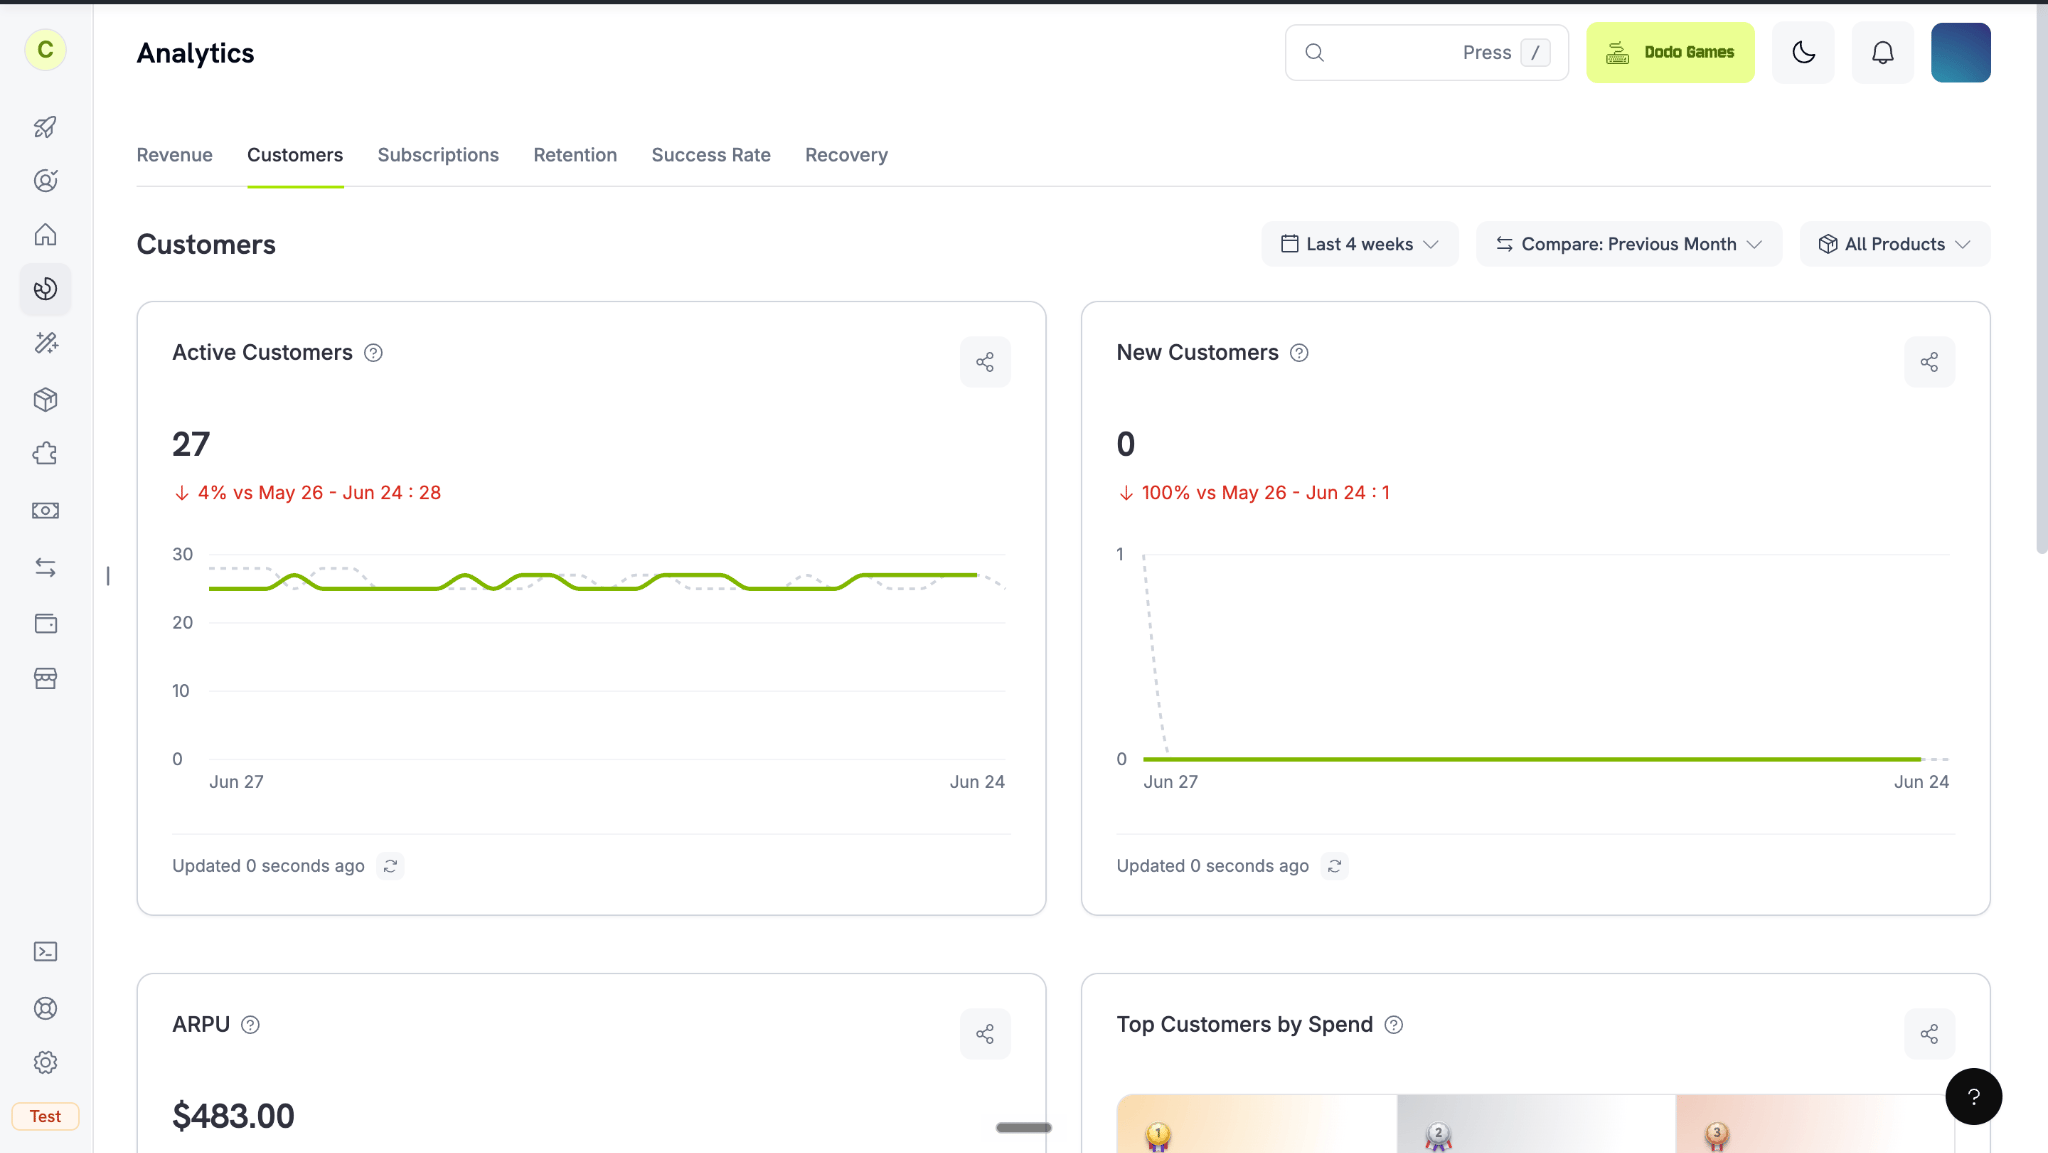
Customers

Active और new customers, ARPU, top customers और modeled LTV।

Subscriptions

MRR, Projected ARR, active subscriptions और पूरा MRR breakdown।

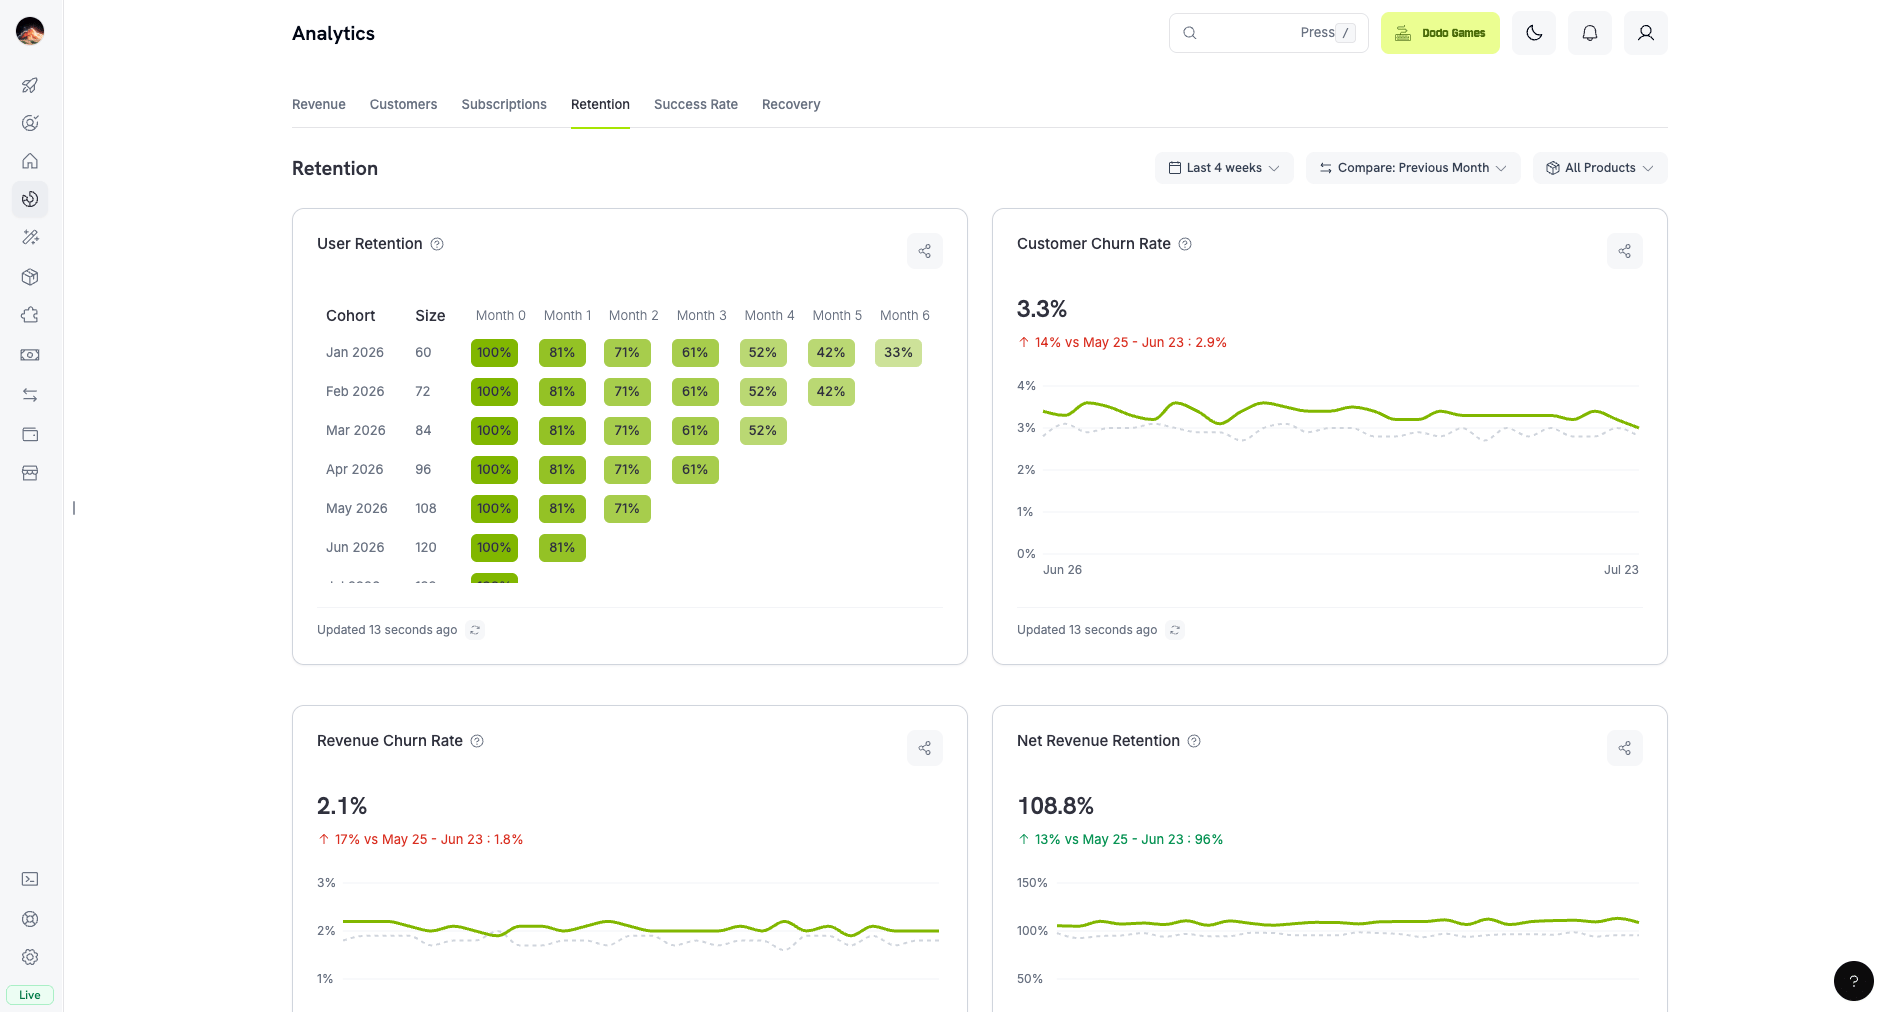
Retention

Customer और revenue churn, NRR/GRR, cohorts और trial conversion।

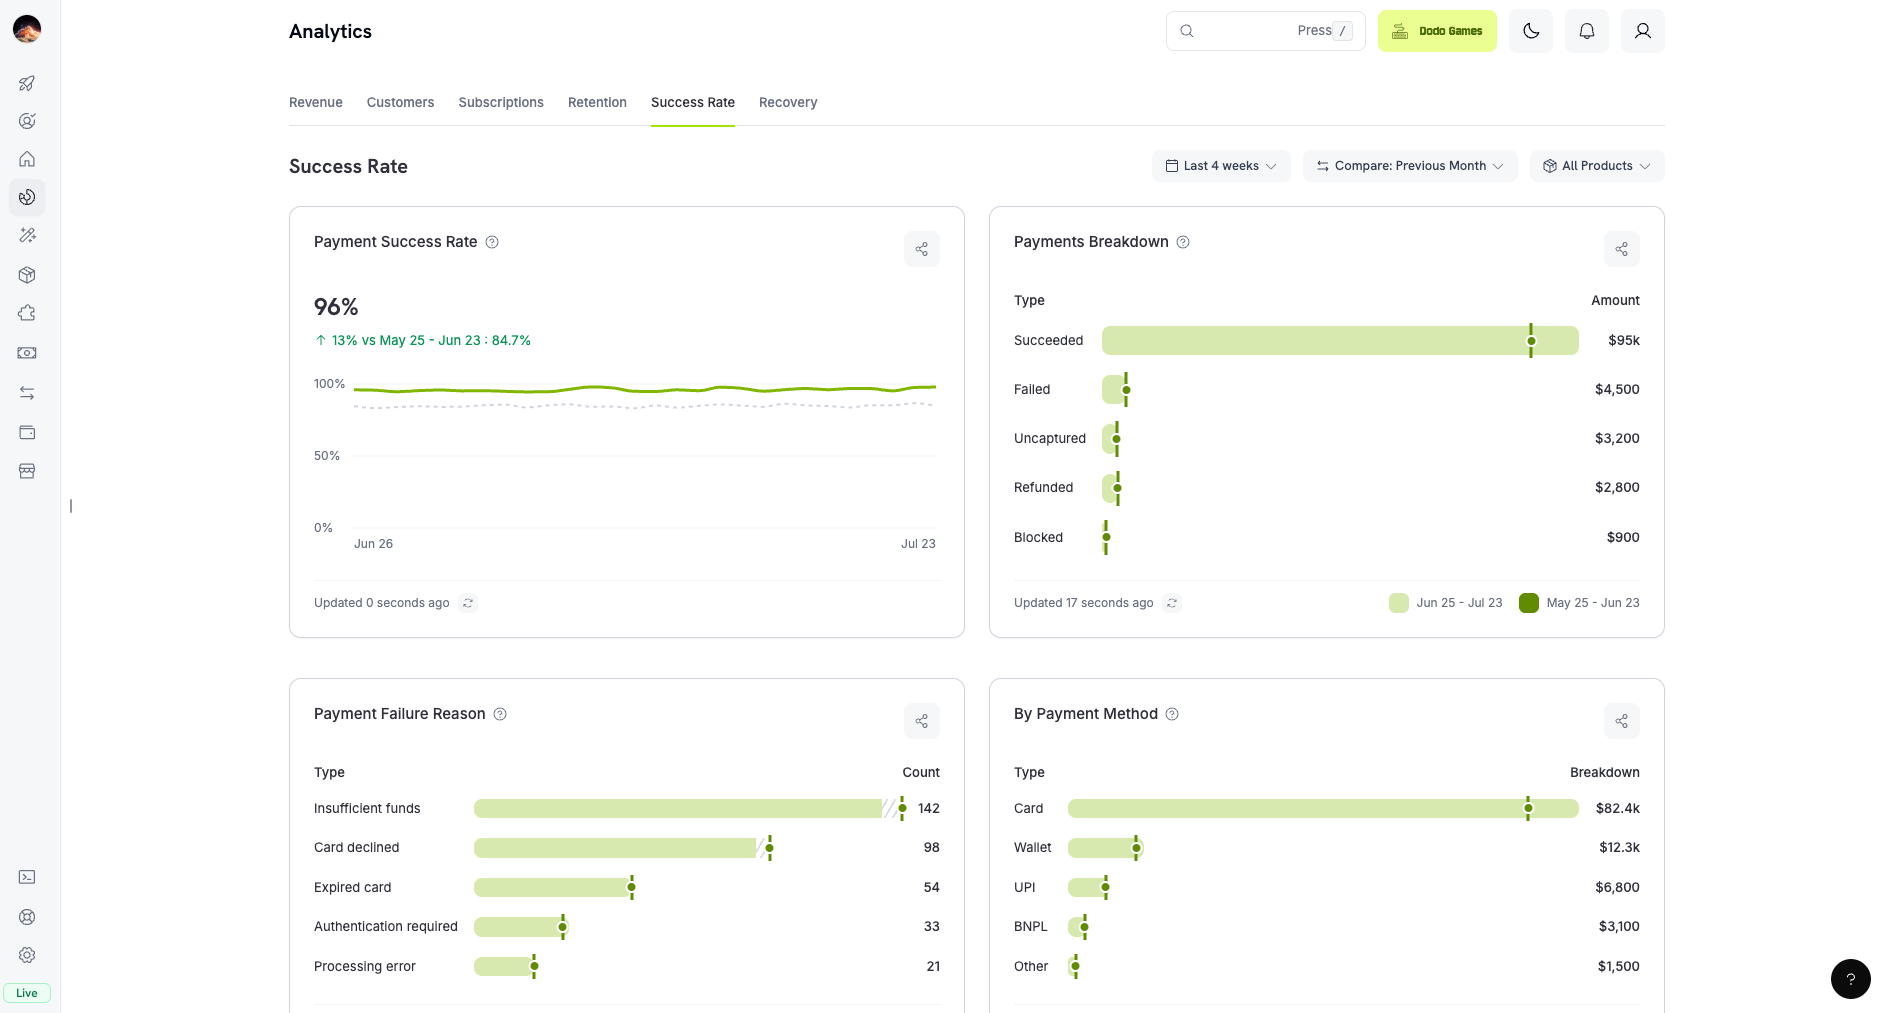
Success Rate

Failure-reason analysis के साथ payment और refund success rates।

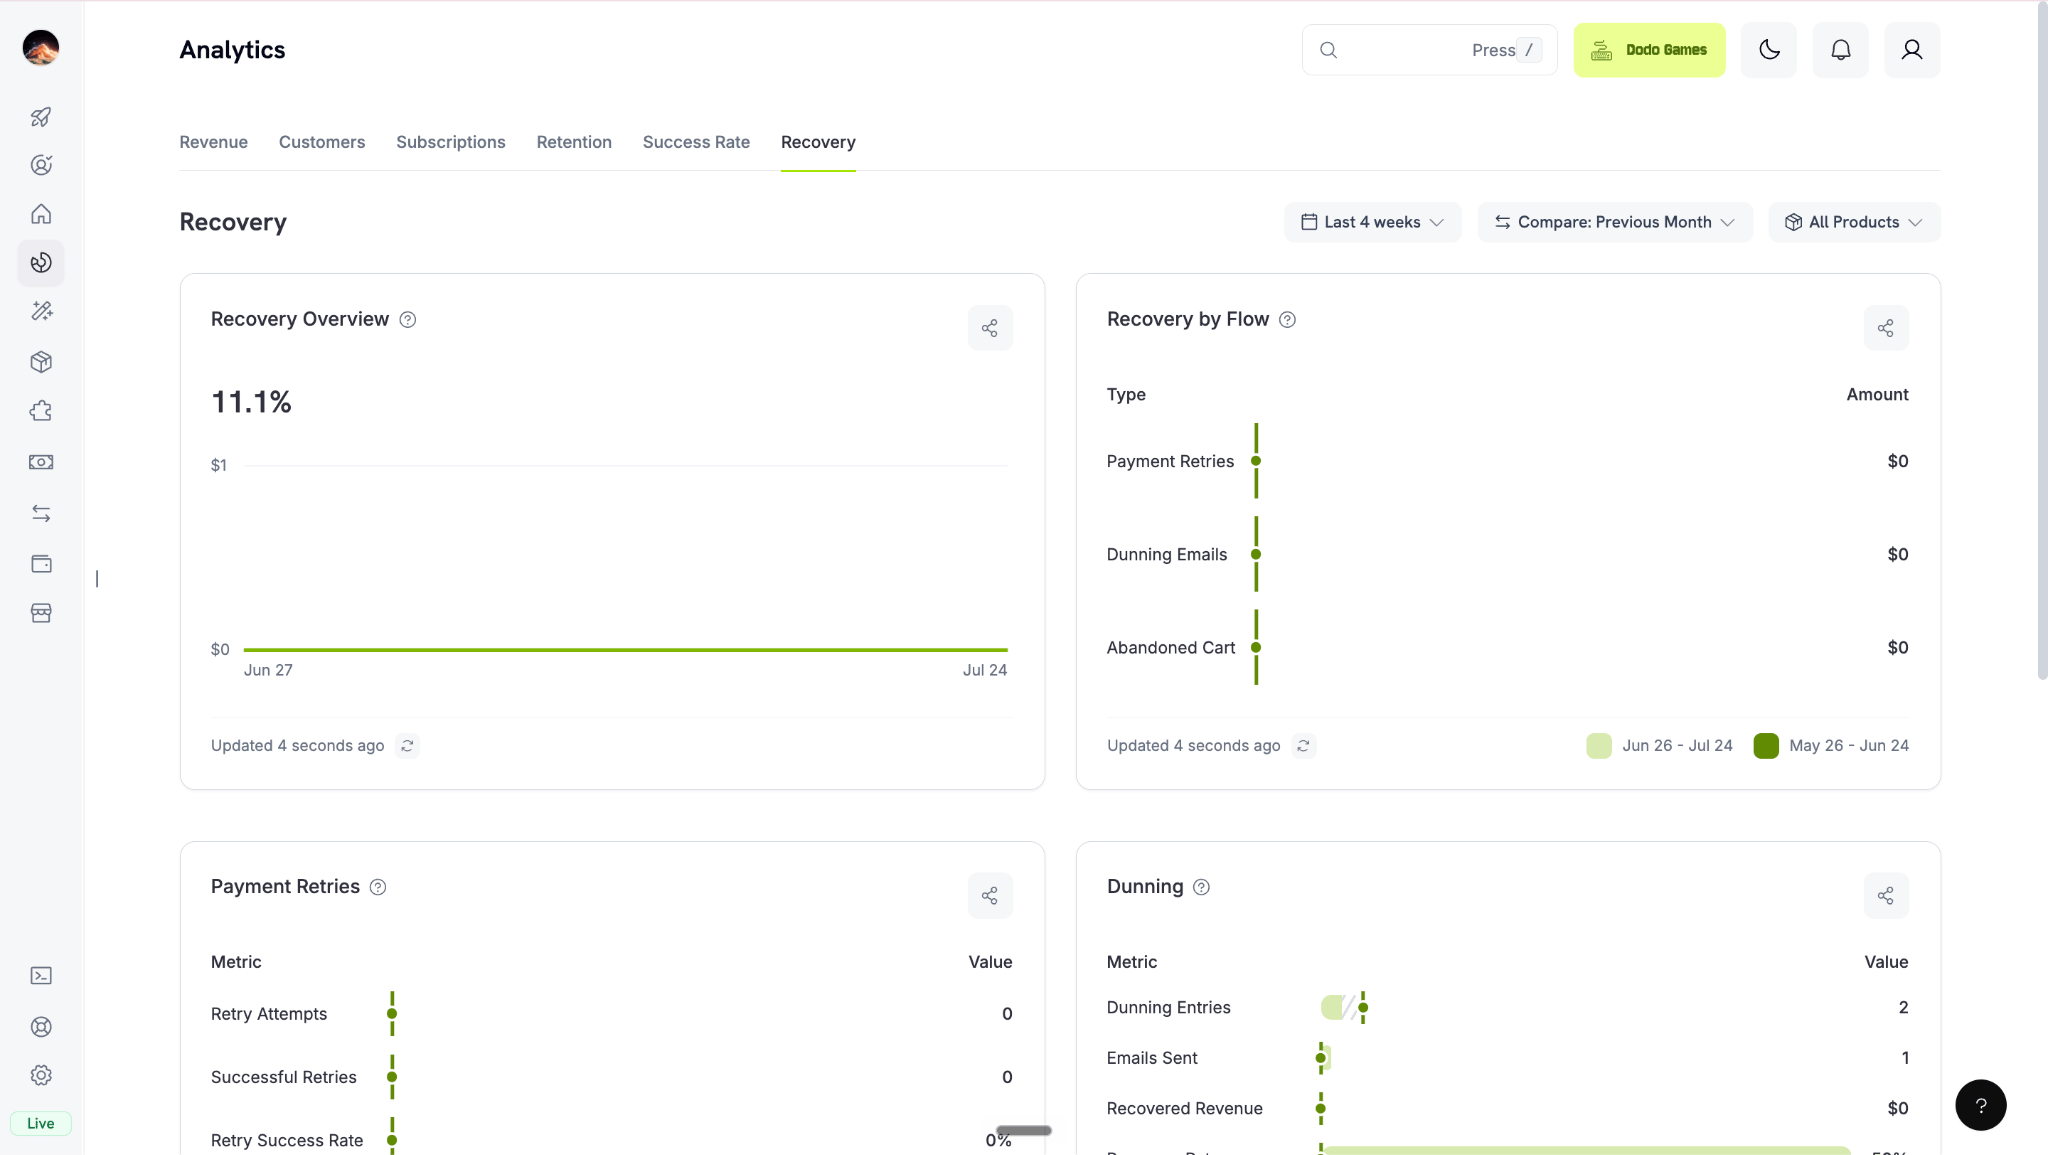
Recovery

Payment retries, dunning और abandoned cart recovery performance।

Filtering & Customization

प्रत्येक tab का अपना filter bar है:
  • समय अवधि: प्रीसेट रेंज — Today, Last 7 days, Last 30 days, Month to date, Quarter to date, Last 6 months, All time — या कस्टम डेट रेंज, साथ ही Daily/Weekly ग्रुपिंग। नए डैशबोर्ड Last 30 days से शुरू होते हैं।
  • तुलना करें: पिछली अवधि या पिछला महीना (डिफ़ॉल्ट रूप से चालू)। All time पर तुलना उपलब्ध नहीं है, क्योंकि तुलना करने के लिए इससे पहले की कोई विंडो नहीं है।
  • प्रोडक्ट: Revenue, Subscriptions और Retention टैब पर उपलब्ध। Product में एक से अधिक विकल्प चुने जा सकते हैं और डिफ़ॉल्ट रूप से All चुना जाता है।
आपकी डेट रेंज और तुलना संबंधी पसंद हर business के लिए याद रखी जाती हैं और आपकी प्रोफ़ाइल के साथ सिंक होती हैं। इसलिए business बदलने, बाद में वापस आने या किसी अन्य डिवाइस पर साइन इन करने पर भी प्रत्येक business में वही विंडो बनी रहती है जिसे आपने पिछली बार इस्तेमाल किया था।
लक्षित insights के लिए specific products, time periods या payment methods पर गहराई से जाने हेतु filters का उपयोग करें।

Revenue Tab

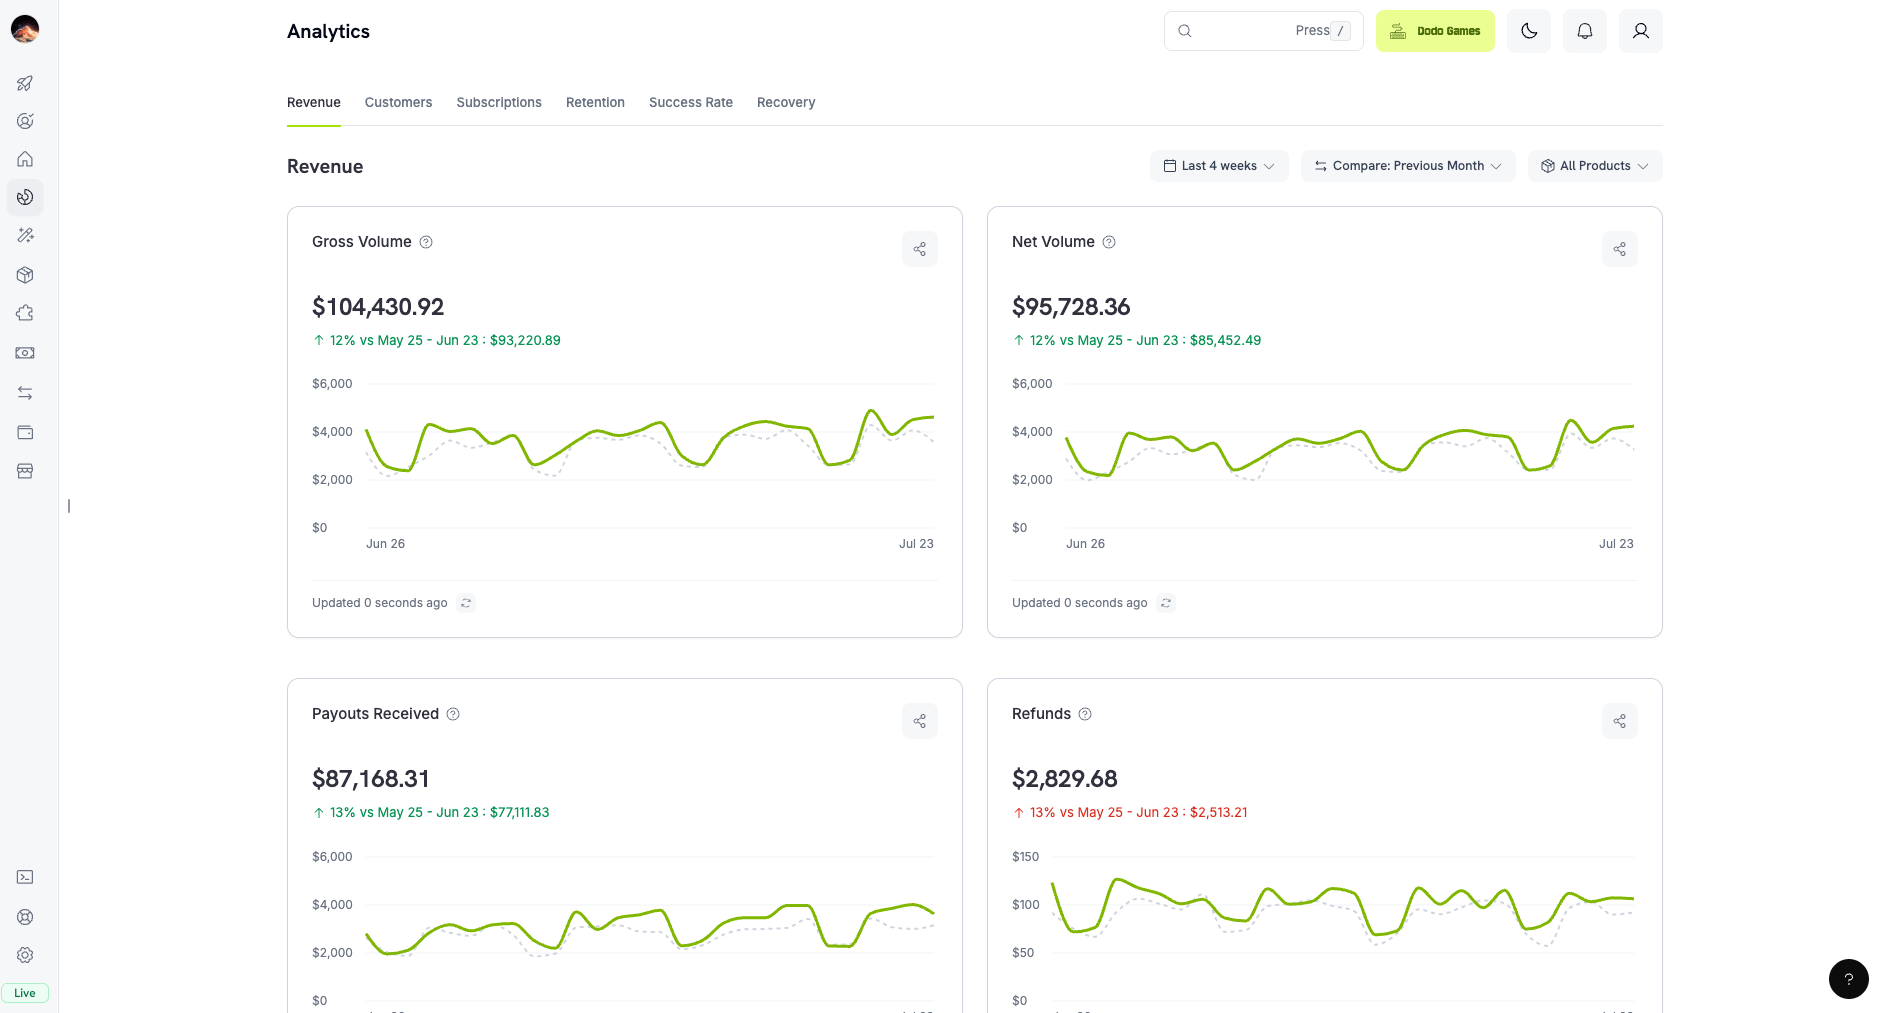
Revenue tab showing gross volume, net volume, payouts received, and refunds cards with trend charts

Revenue tab: gross/net volume, payouts, and refunds

अपनी income, payouts और dispute activity को track करके revenue trends समझें और अपने सबसे अच्छा प्रदर्शन करने वाले markets की पहचान करें। Gross/Net dropdown का उपयोग करके headline figure, chart और country ranking को gross और net values के बीच बदलें।

Customers Tab

Customers tab showing active customers, new customers, ARPU, and top customers by spend

Customers tab: active and new customers, ARPU, and top customers

अपनी customer acquisition, retention और spending patterns का विश्लेषण करके customer strategy को बेहतर बनाएं।

Subscriptions Tab

अपने recurring revenue को monitor करें और समझें कि आपका Monthly Recurring Revenue (MRR) समय के साथ कैसे बदलता है।
MRR concurrent subscriptions (प्रति customer summed) को ध्यान में रखता है और प्रत्येक subscription की paid-through अवधि के आधार पर prorate करता है।

Retention Tab

Retention tab showing the user retention cohort matrix, customer churn rate, revenue churn rate, and net revenue retention

Retention tab: churn rates, retention matrix, and NRR/GRR

Customer retention और churn patterns को monitor करें।

Success Rate Tab

Success Rate tab showing payment success rate, payments breakdown, payment failure reasons, and success by payment method

Success Rate tab: payment and refund success rates with failure analysis

Transaction issues की पहचान करके उन्हें तुरंत हल करने के लिए payment और refund success rates को monitor करें।

Transaction Failure Reference

सभी संभावित transaction failure codes और उनके reasons प्राप्त करें।
यदि आपको success rates में गिरावट या failures में अचानक वृद्धि दिखाई दे, तो failure reasons की समीक्षा करें और revenue loss को कम करने के लिए उन्हें तुरंत address करें।

Recovery Tab

Recovery tab showing recovery overview, recovery by flow, payment retries, and dunning metrics

Recovery tab: retries, dunning, and abandoned cart recovery

Automated retries, dunning emails और abandoned cart recovery के माध्यम से Dodo Payments आपकी ओर से कितना revenue recover करता है, इसे track करें।

Recovery Features

Payment retries, dunning और abandoned cart recovery configure करने के बारे में अधिक जानें।

Product-Level Analytics

Business-wide metrics के अतिरिक्त, आप प्रत्येक individual product के लिए detailed analytics देख सकते हैं। उस product के लिए dedicated analytics dashboard access करने हेतु Products > [Select a Product] पर जाएँ।
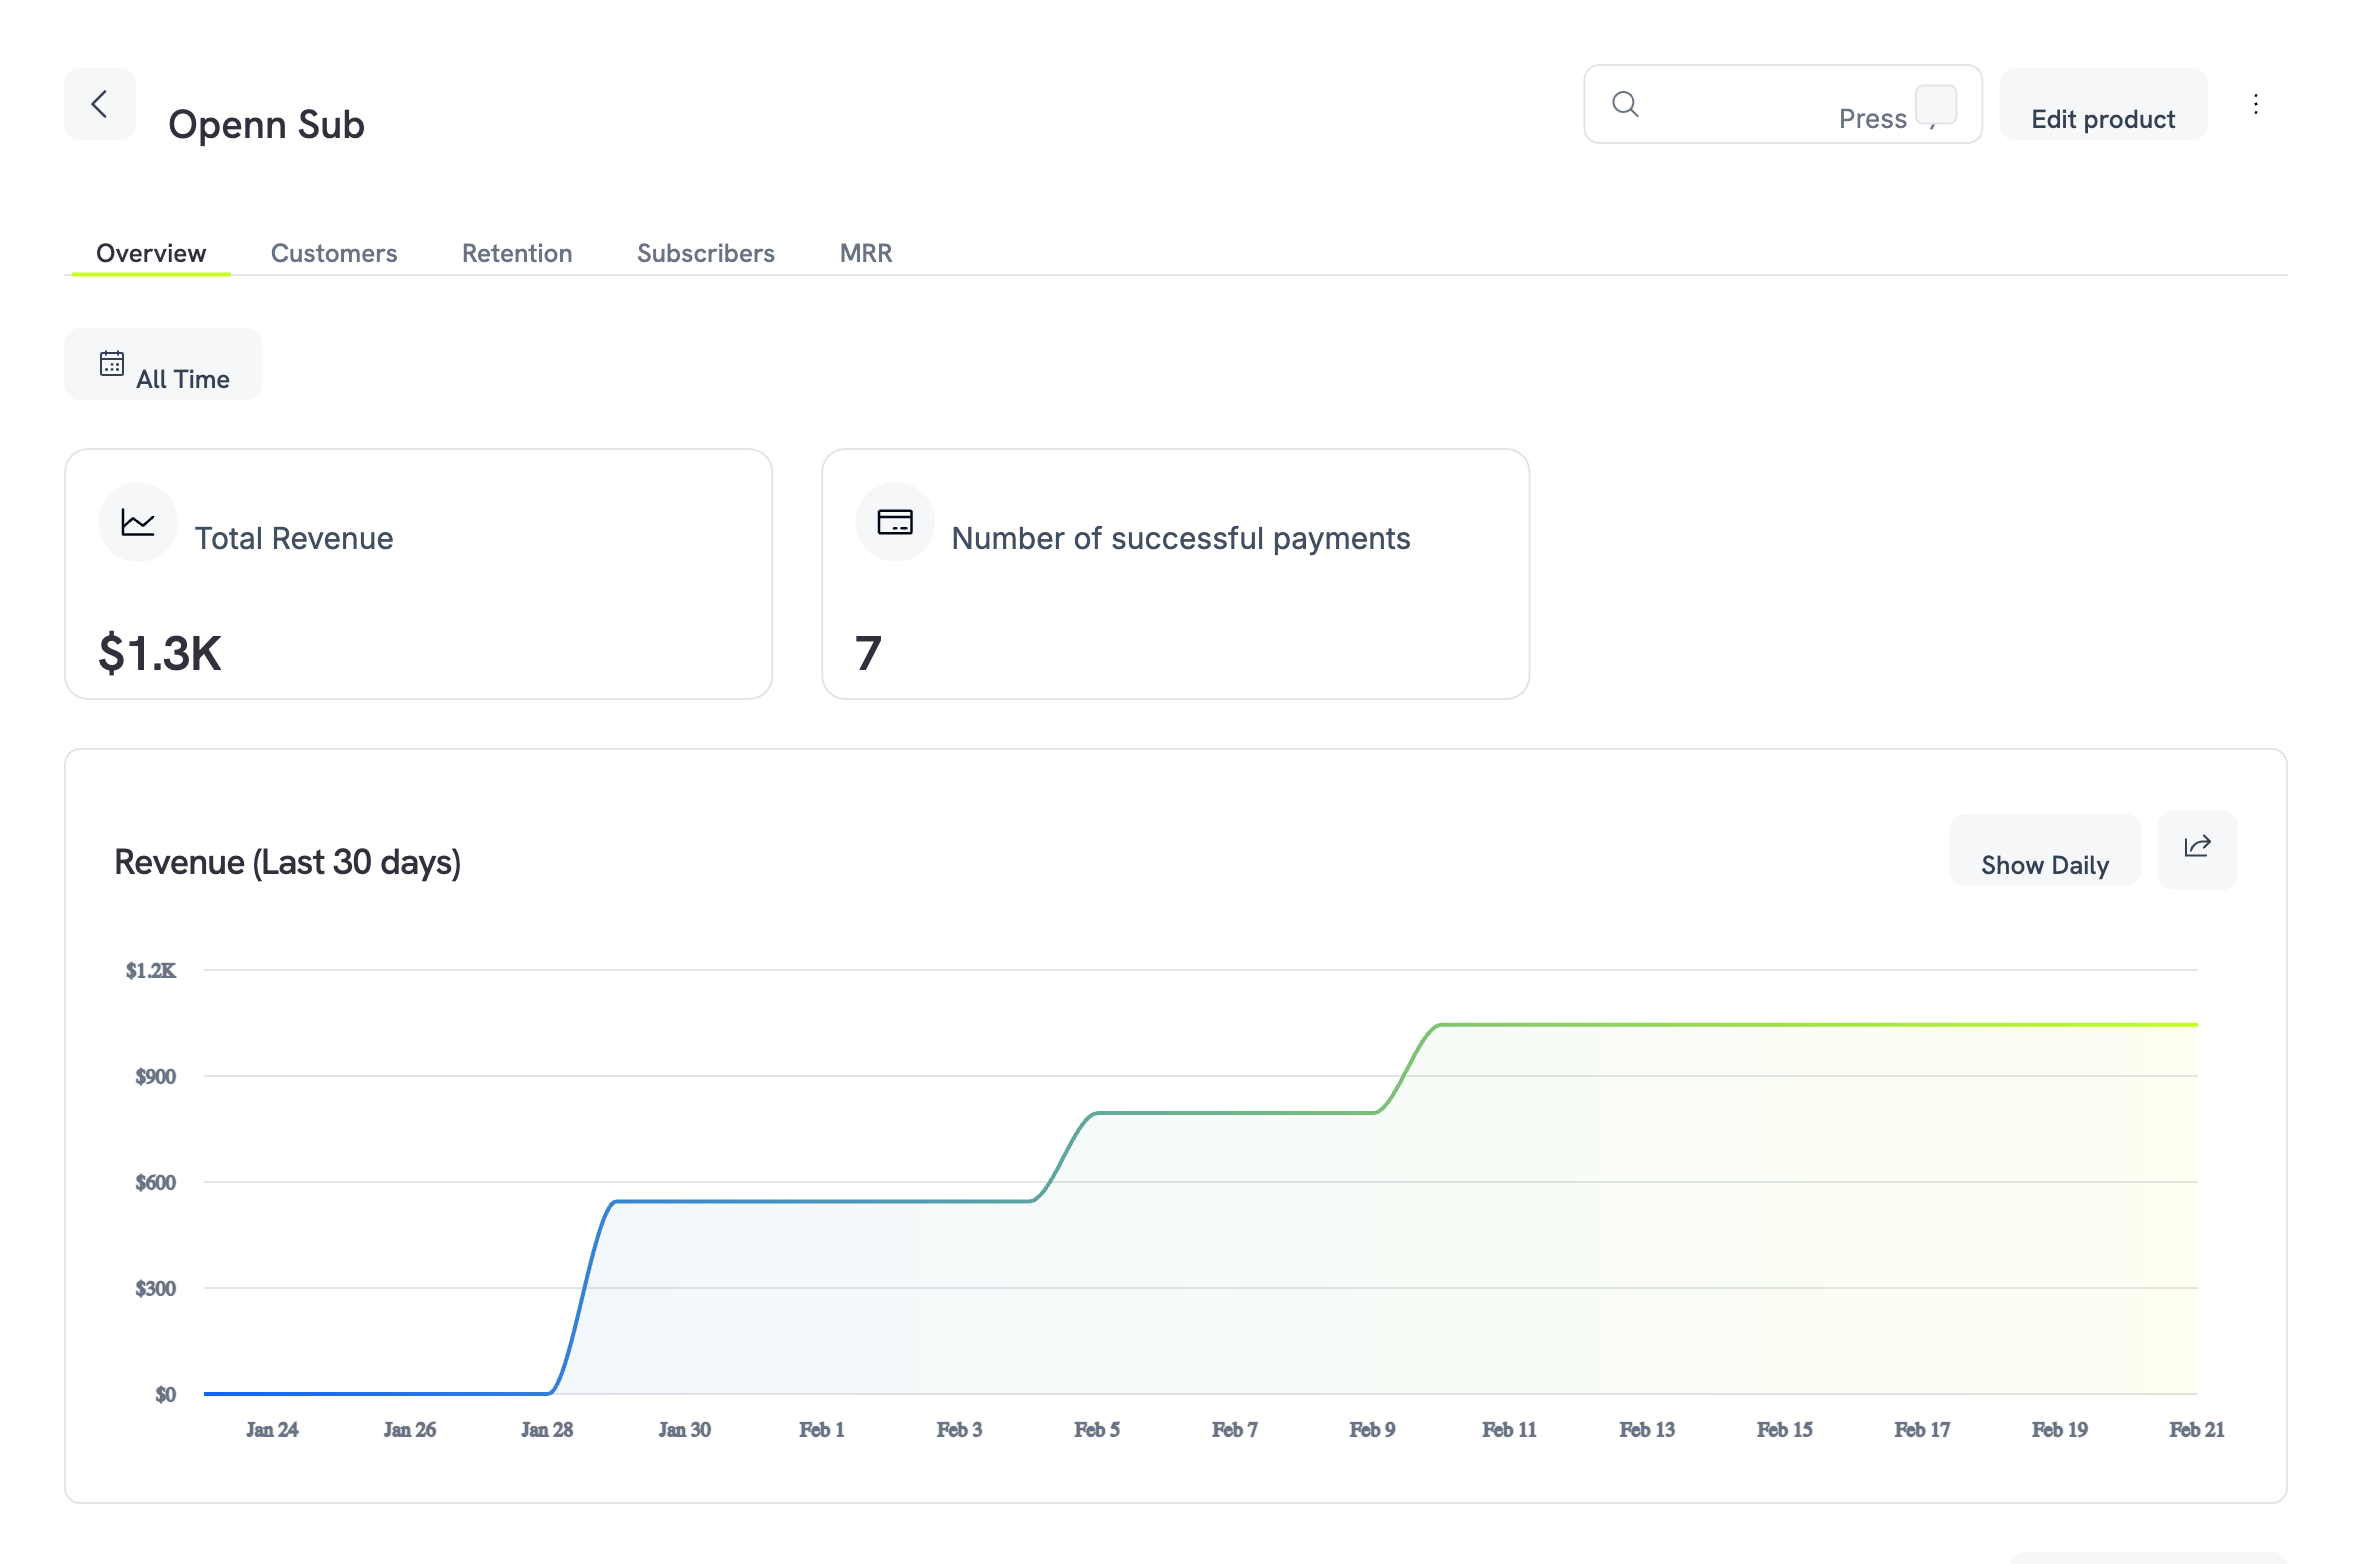
Product analytics overview tab with total revenue, successful payments, and revenue trend chart

Product analytics overview showing revenue summary and trend chart

Product analytics dashboard को पाँच tabs में व्यवस्थित किया गया है:

Overview

Revenue summary, trend chart और transaction history।

Customers

Spend के आधार पर ranked top customers और full breakdown table।

Retention

Customer और revenue churn rates के साथ trend analysis।

Subscribers

Status और billing details वाले सभी subscriptions।

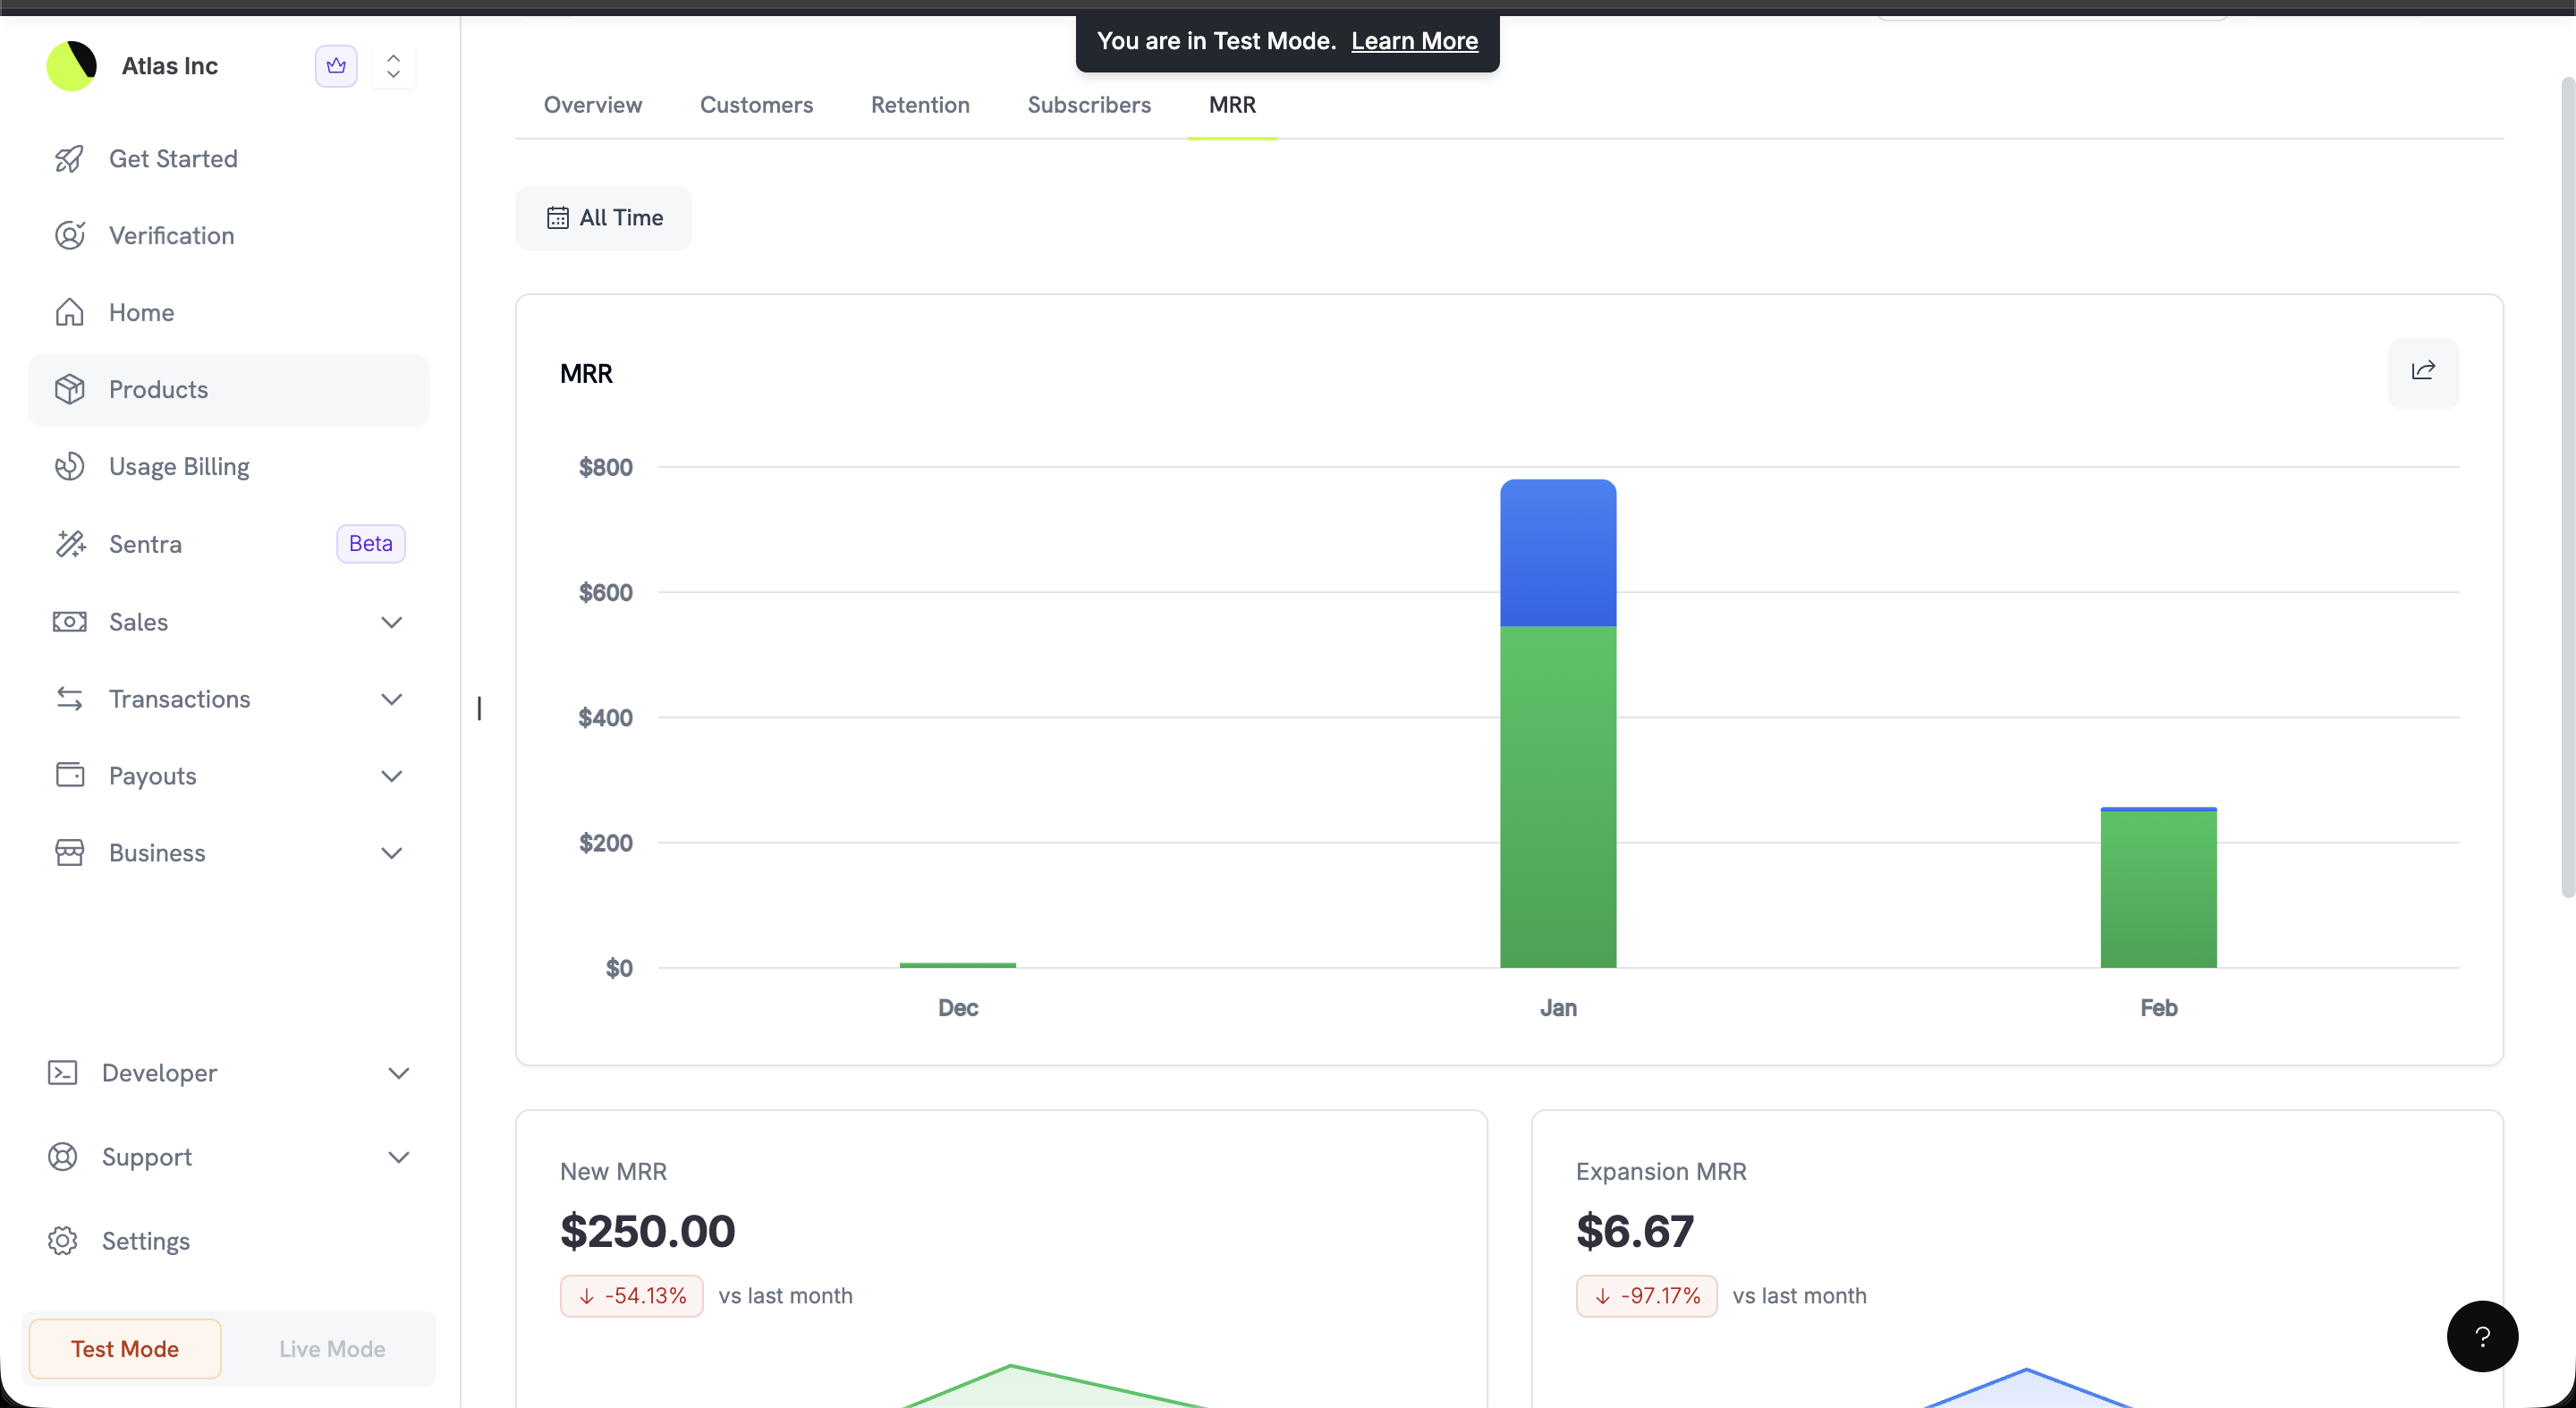
MRR

Monthly Recurring Revenue breakdown — new, expansion, churned और net।
सभी tabs में date filter उपलब्ध है (default All Time), जिससे आप किसी भी period पर focus कर सकते हैं।

Overview Tab

Overview tab product की financial performance का high-level snapshot प्रदान करता है।
  • Total Revenue: इस product से generated cumulative revenue।
  • Number of Successful Payments: Successful transactions की कुल संख्या।
  • Revenue Trend Chart: समय के साथ revenue दिखाने वाला 30-day line chart। Show Daily button का उपयोग करके cumulative और daily views के बीच बदलें।
Chart के नीचे Transactions table इस product के प्रत्येक payment को सूचीबद्ध करती है:
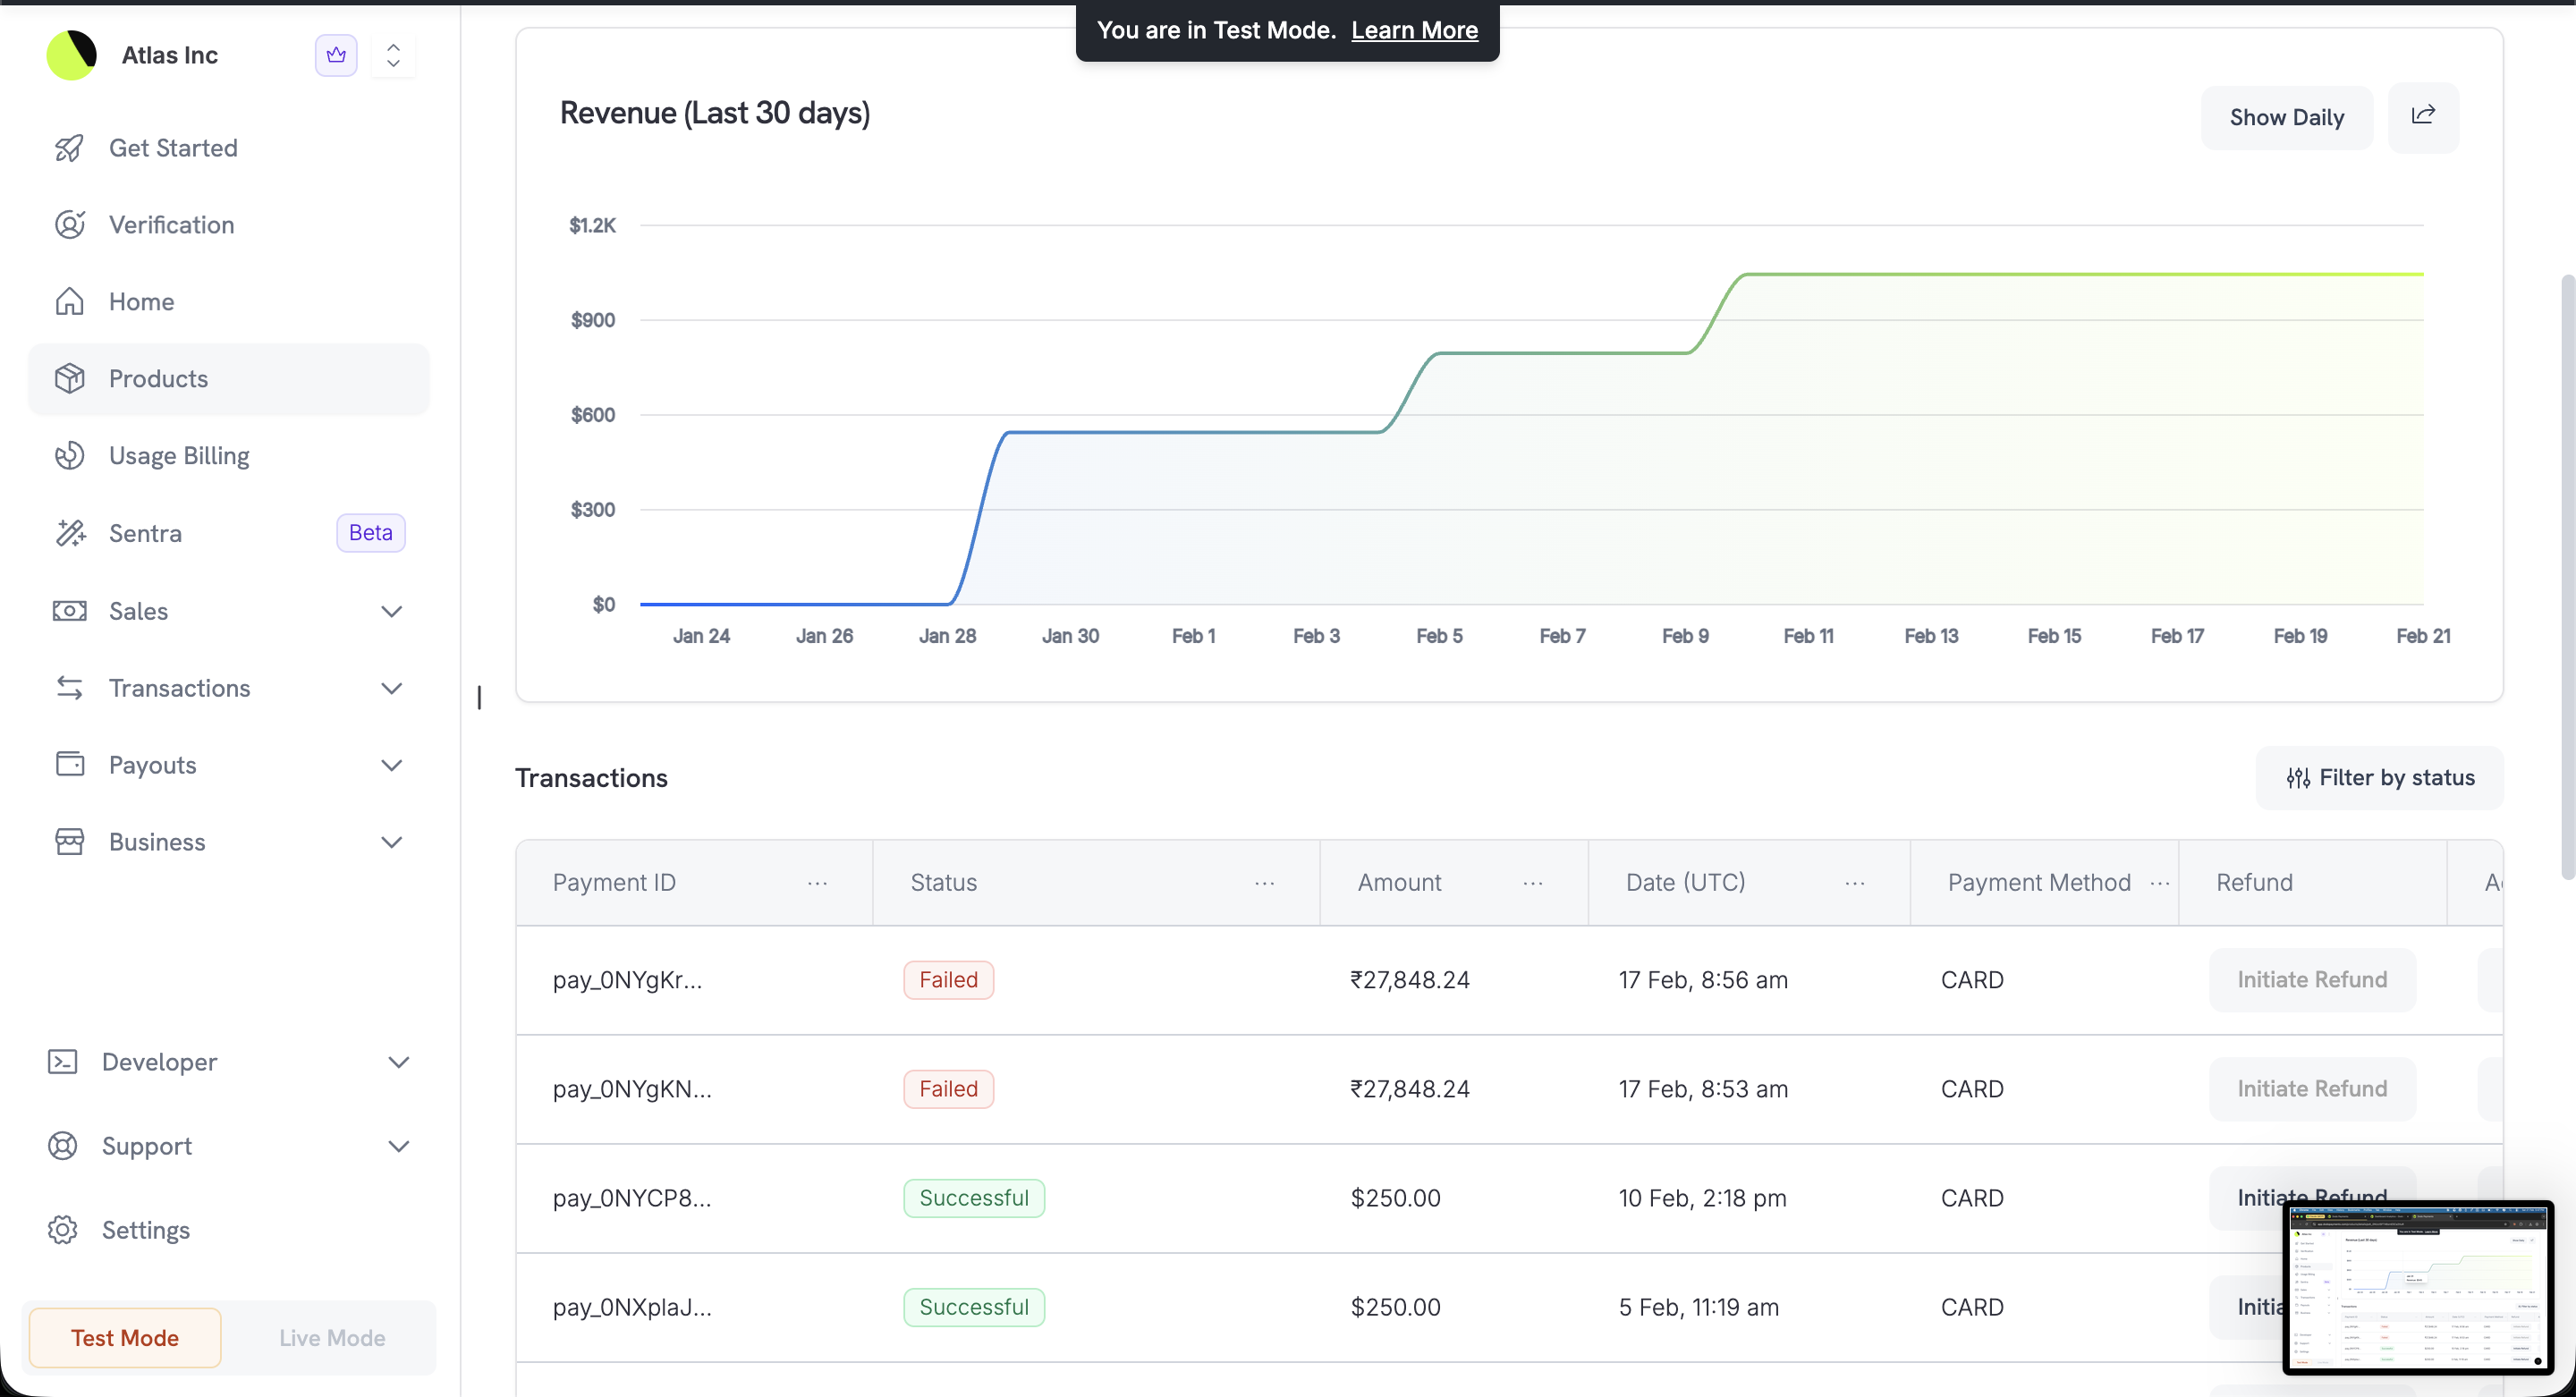
Product transactions table with payment IDs, statuses, amounts, and refund actions

Transactions table showing payment history for the product

List को successful या failed transactions तक सीमित करने के लिए Filter by status button का उपयोग करें।

Customers Tab

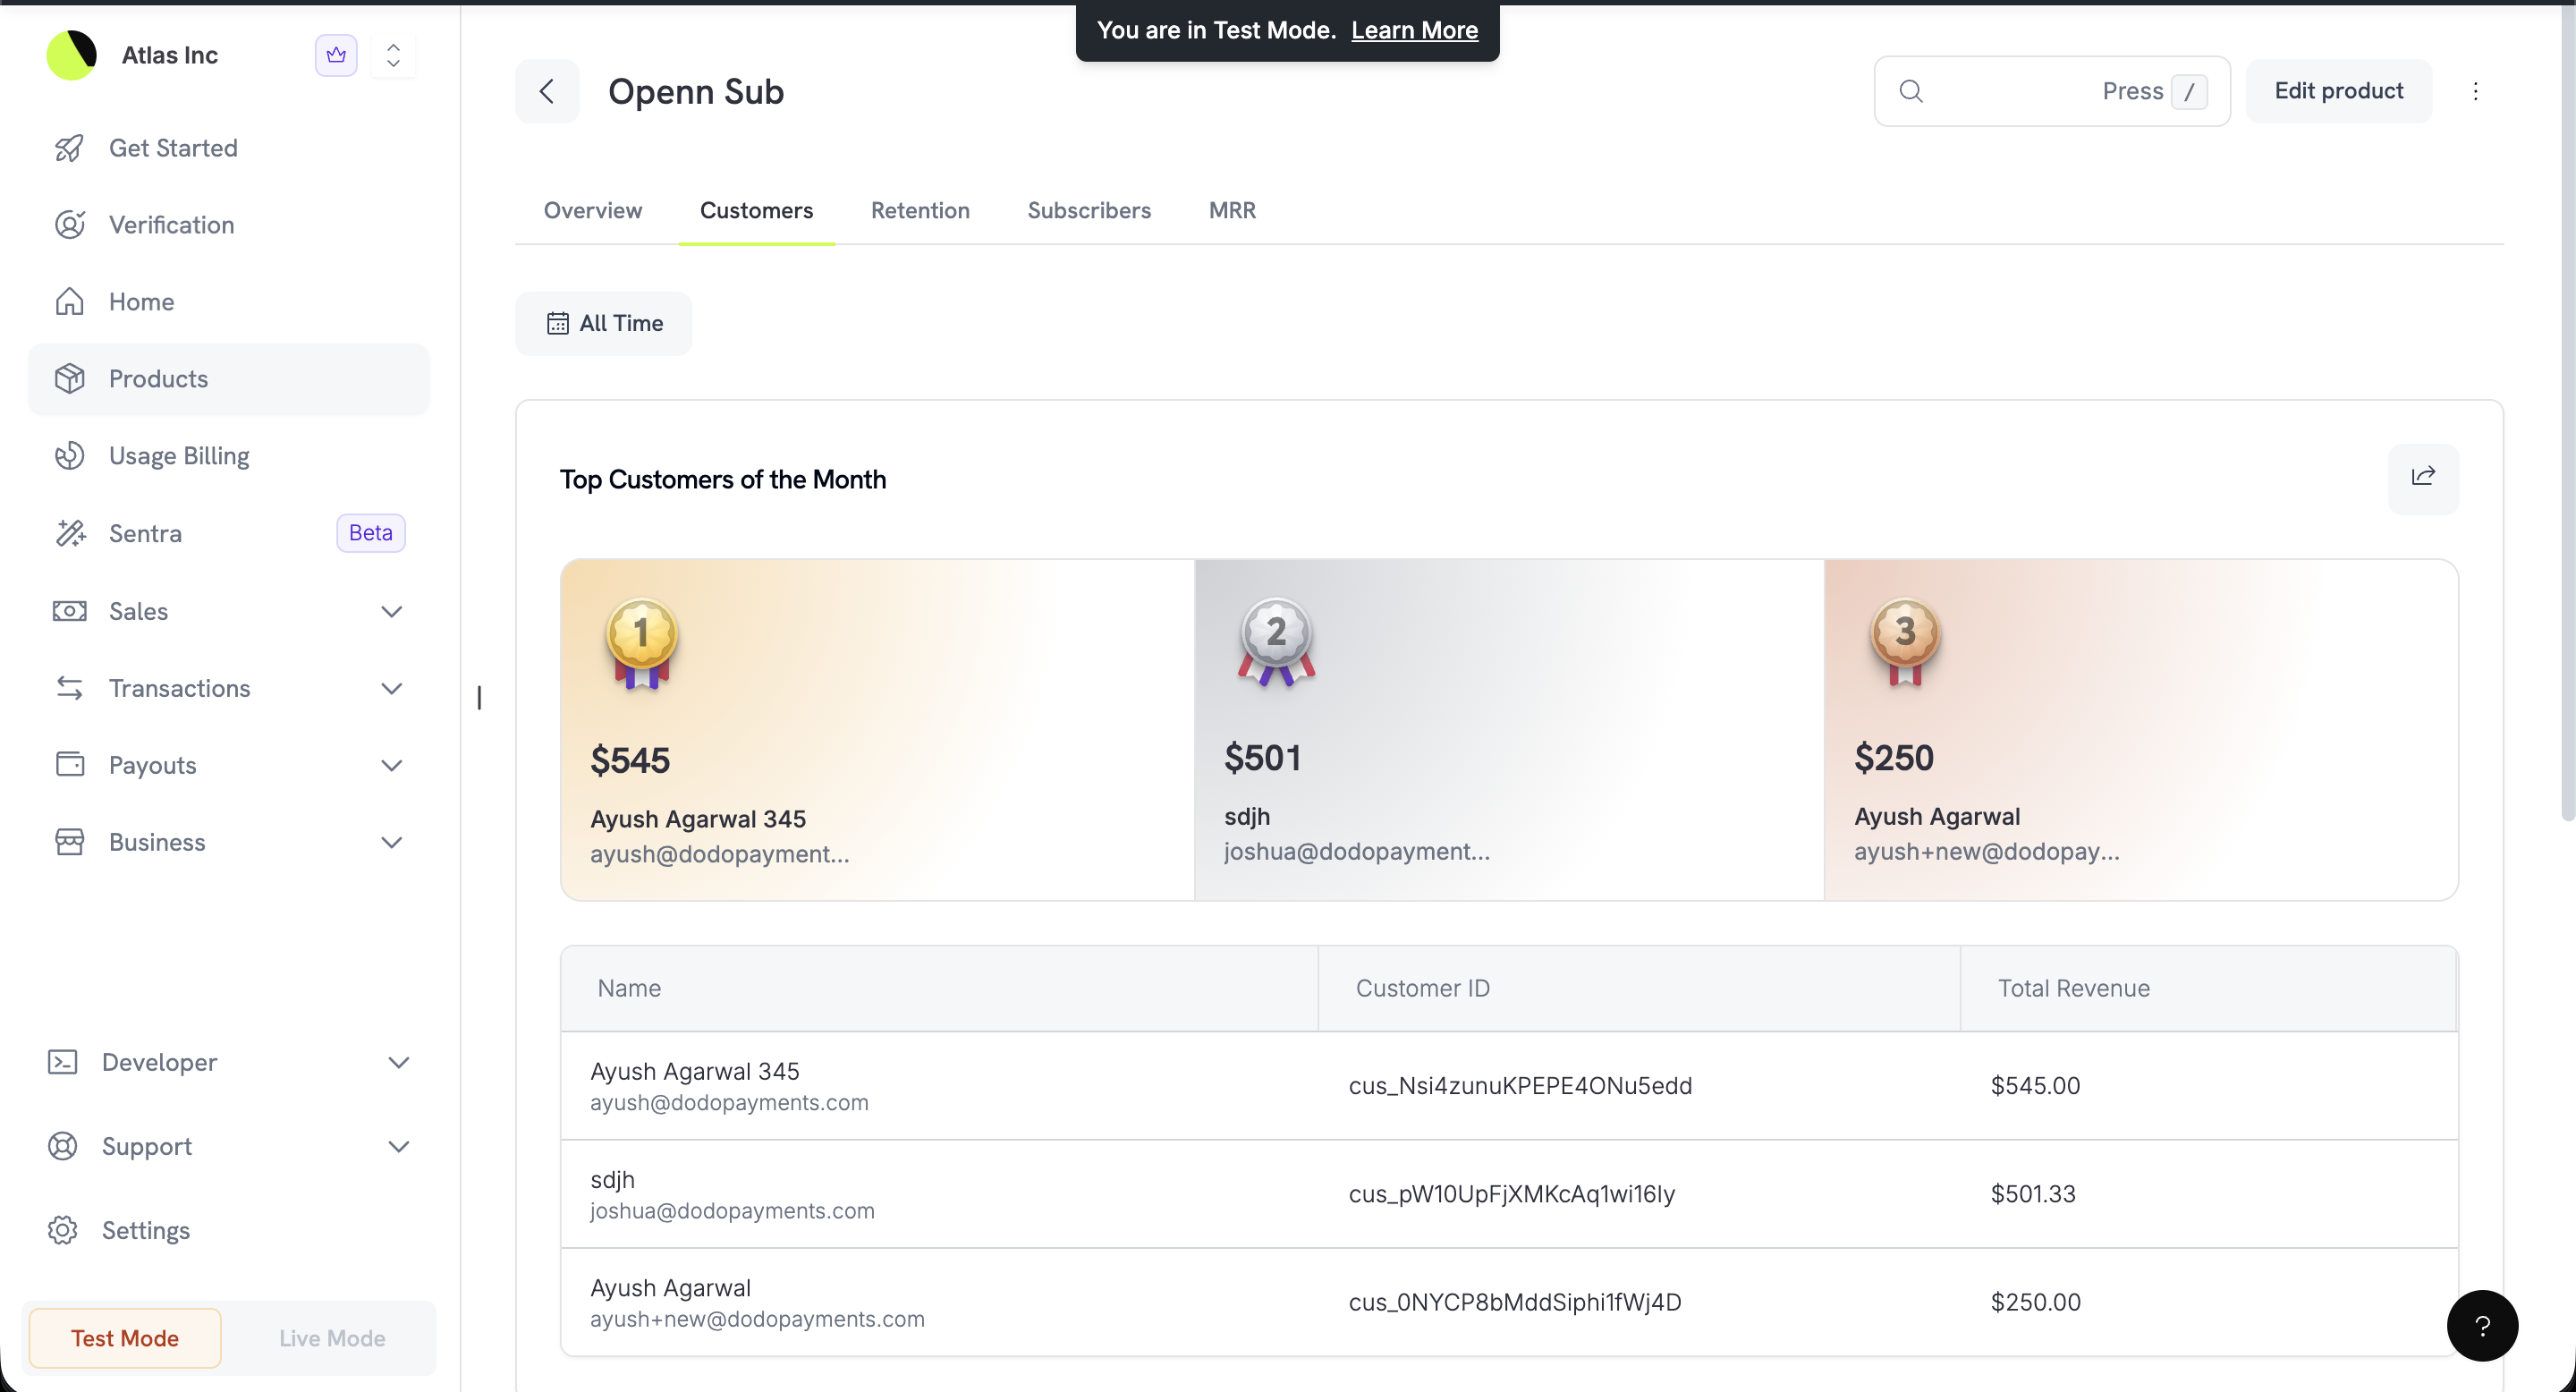
देखें कि यह product कौन खरीद रहा है और वे कितना spend कर रहे हैं।
Customers tab showing top 3 customers ranked by revenue with a detailed breakdown table

Top customers of the month with podium ranking and customer table

  • Top Customers of the Month: एक visual podium कुल spend के आधार पर ranked आपके top 3 customers को highlight करता है और revenue amount, name तथा email दिखाता है।
  • Customer Table: सभी customers का detailed breakdown, जिसमें उनका Customer ID और इस product का total revenue शामिल है।

Retention Tab

समझें कि यह product अपने subscribers को कितनी अच्छी तरह retain करता है।
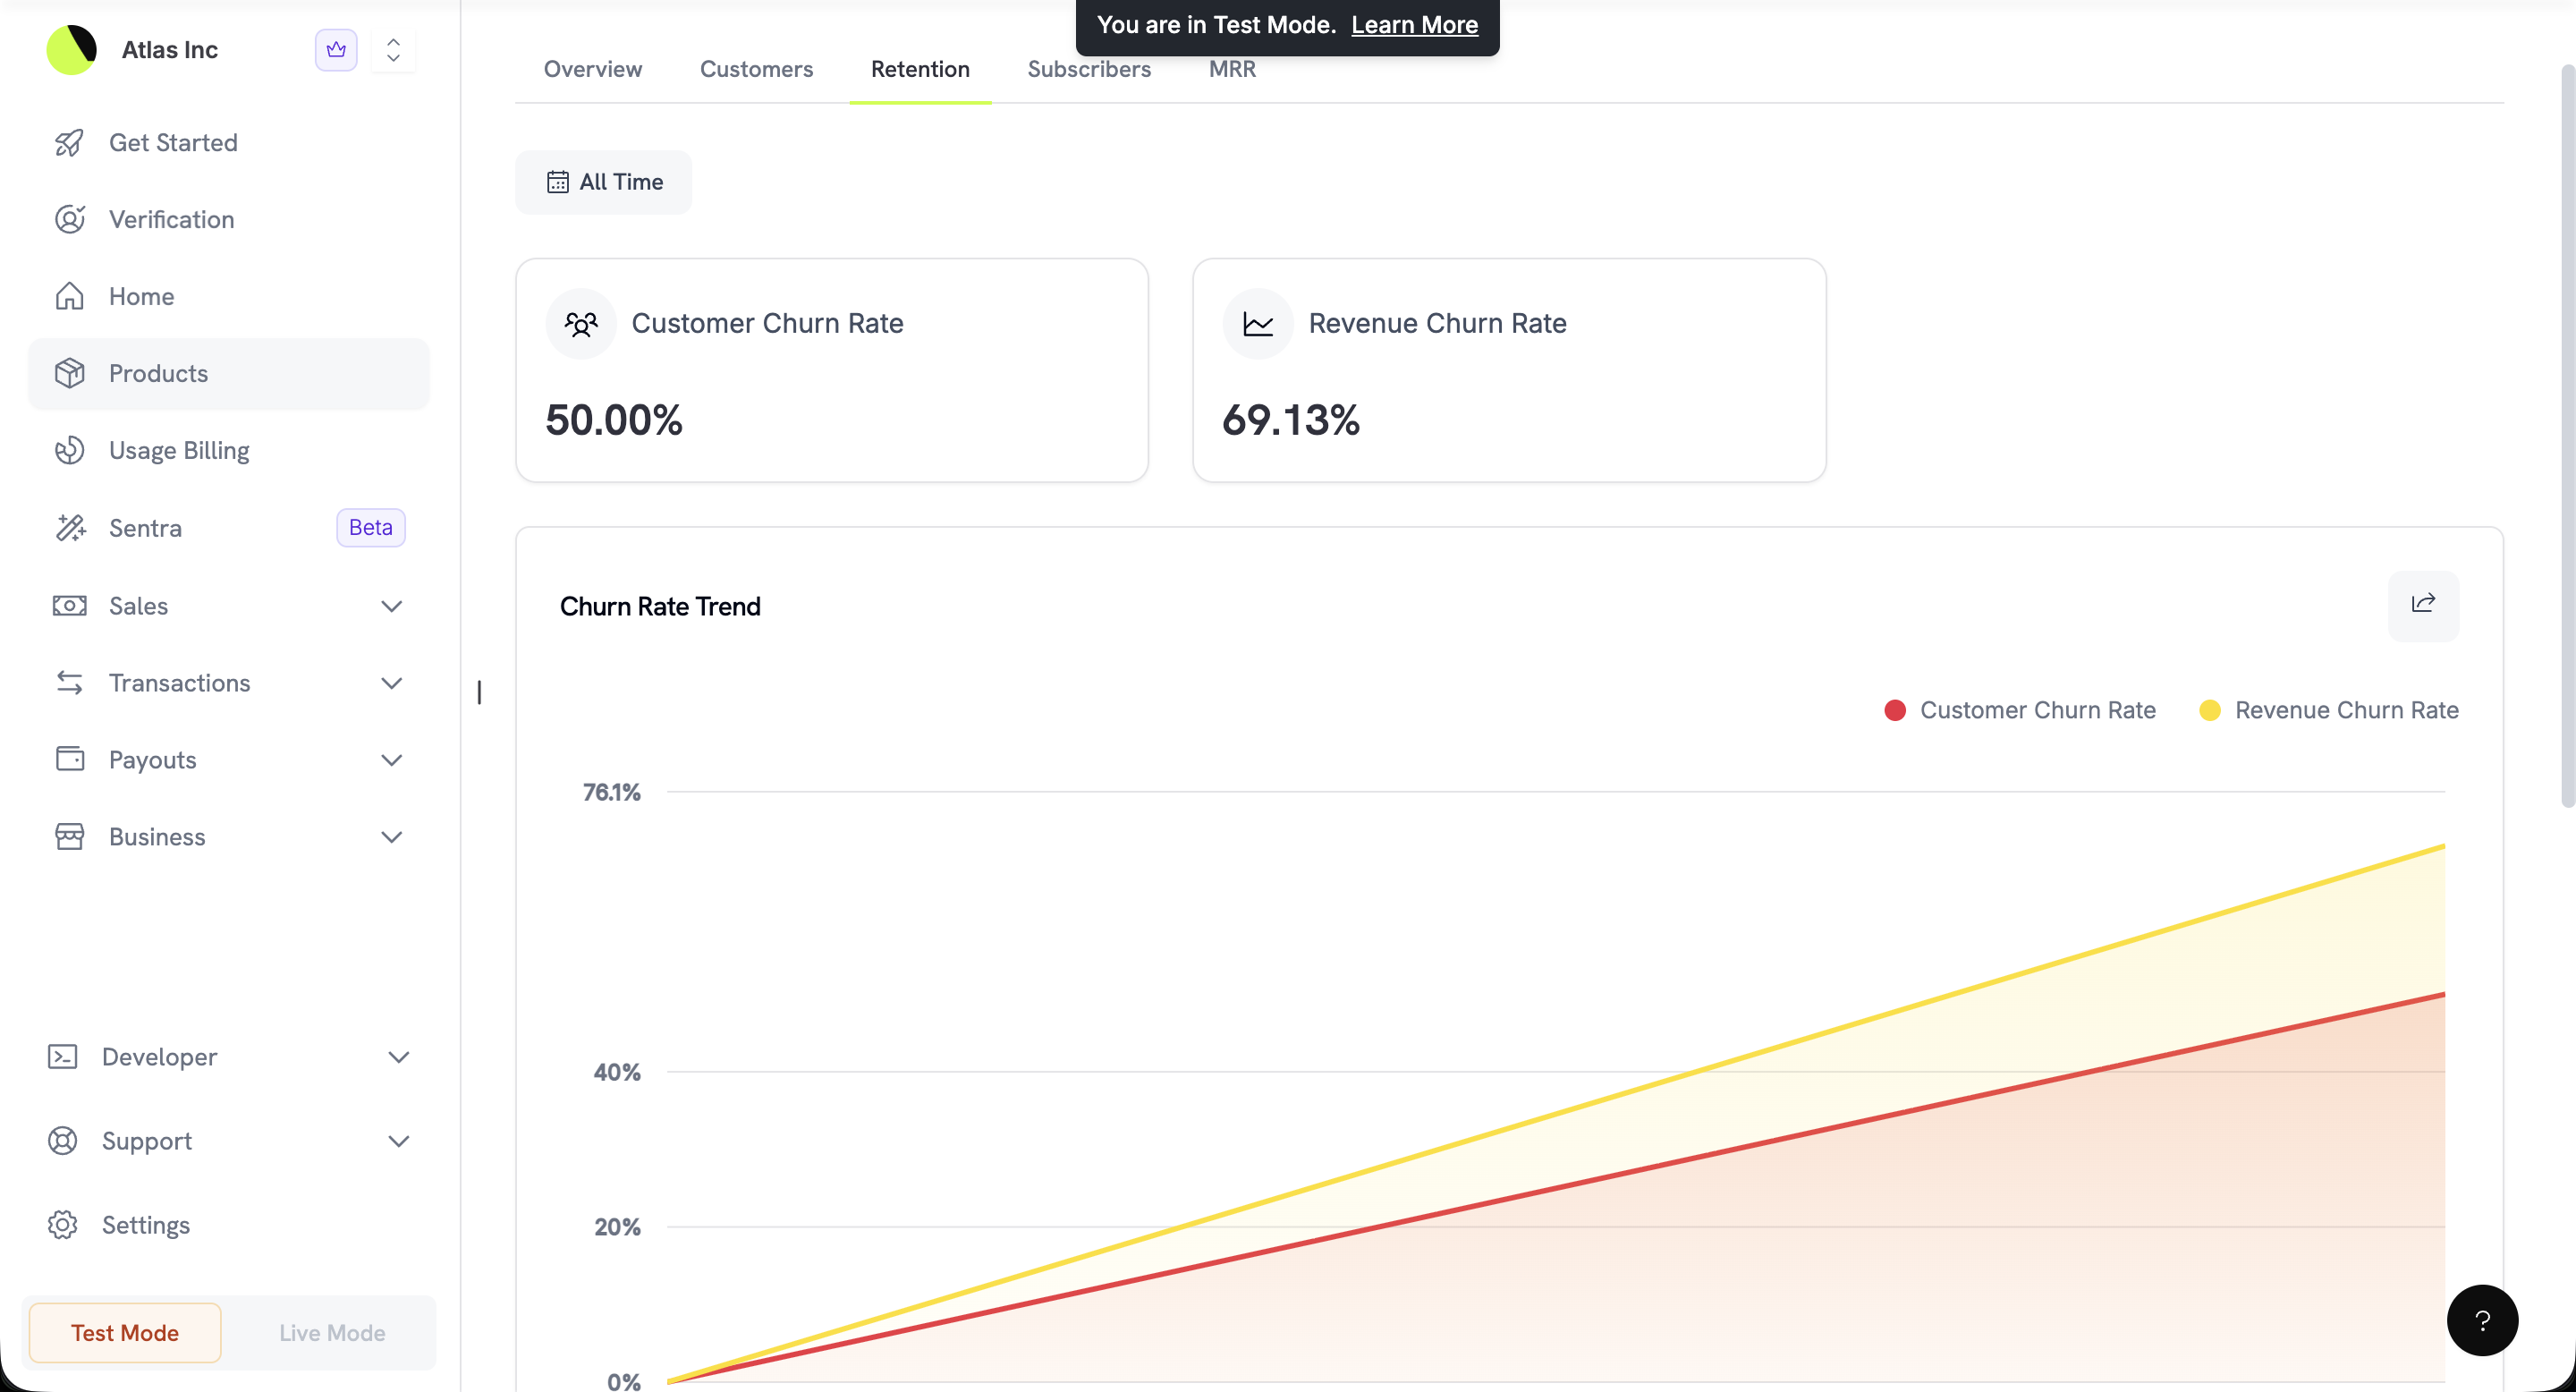
Retention tab showing customer churn rate, revenue churn rate, and churn rate trend chart

Customer and revenue churn rates with trend analysis

  • Customer Churn Rate: Cancel करने वाले subscribers का percentage।
  • Revenue Churn Rate: Cancellations और downgrades से खोए गए revenue का percentage।
  • Churn Rate Trend: समय के साथ दोनों metrics को track करने वाला dual-line chart, जिससे आप trends पहचानकर corrective action ले सकते हैं।

Subscribers Tab

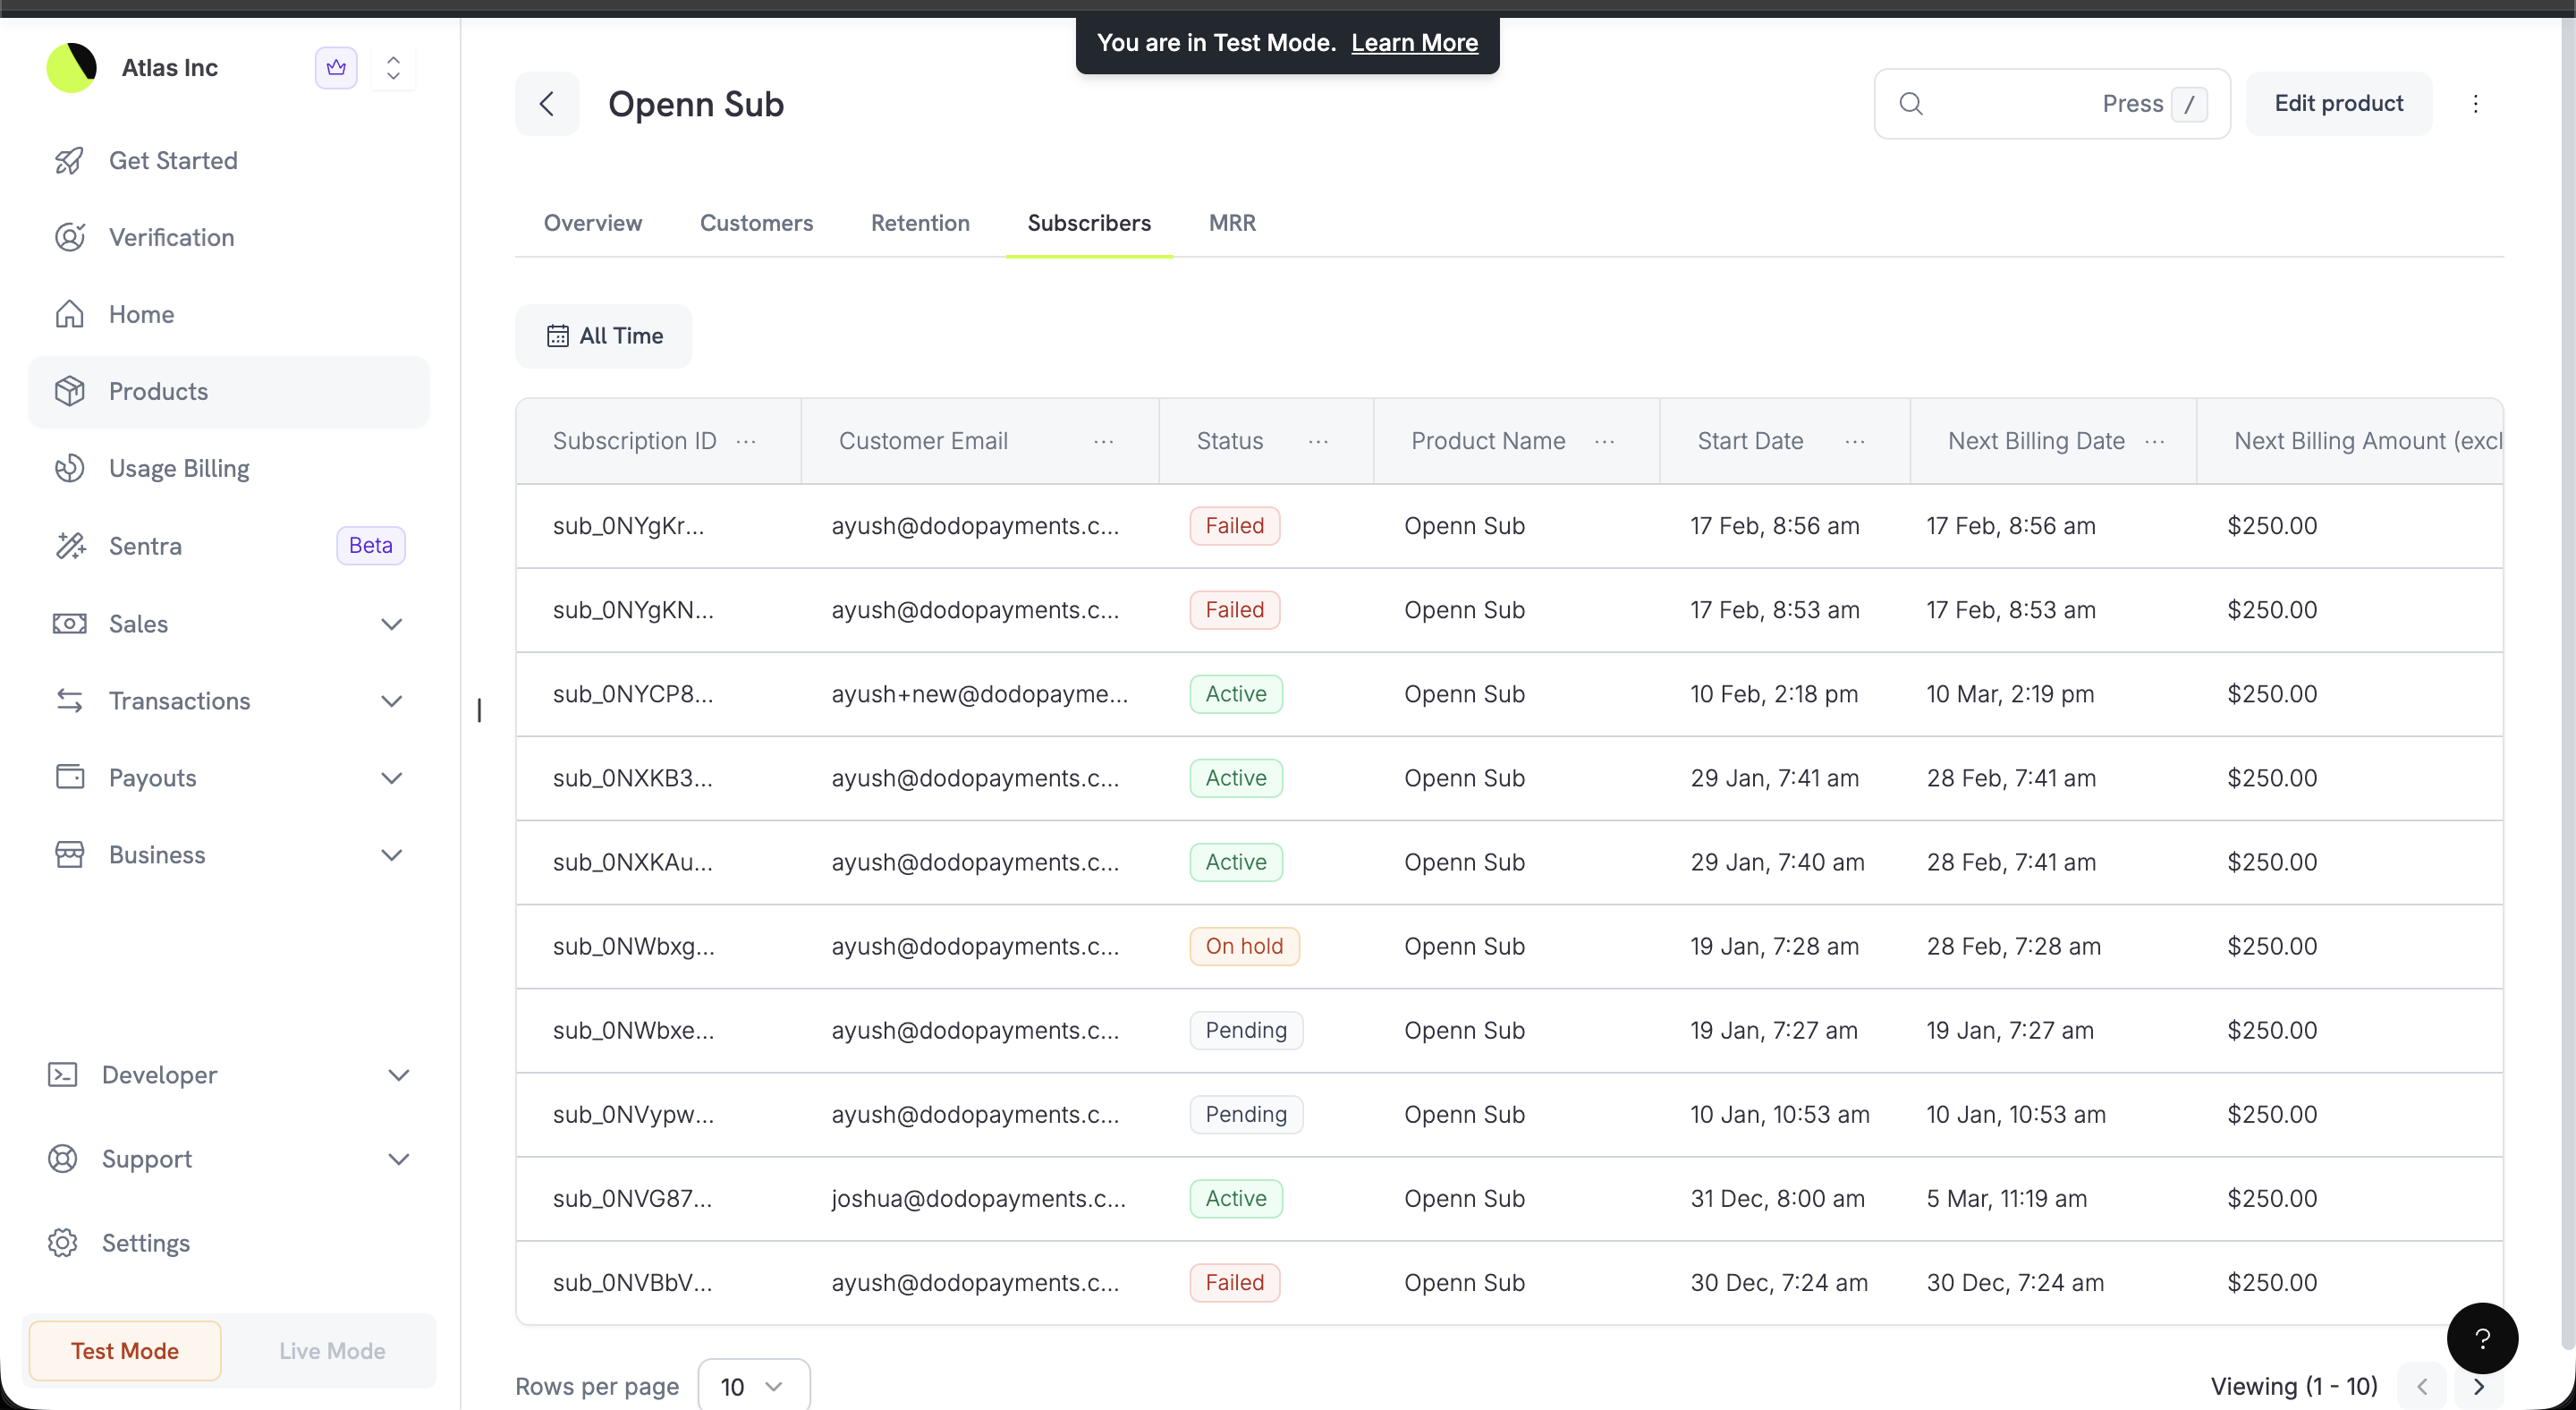
इस product से जुड़े सभी subscriptions की complete list।
Subscribers tab with subscription IDs, customer emails, statuses, start dates, and next billing information

Subscribers table showing all subscriptions with statuses and billing details

MRR Tab

आपके product के Monthly Recurring Revenue का detailed breakdown।
MRR tab with stacked bar chart showing new, expansion, and churned MRR by month

MRR stacked bar chart showing monthly revenue composition
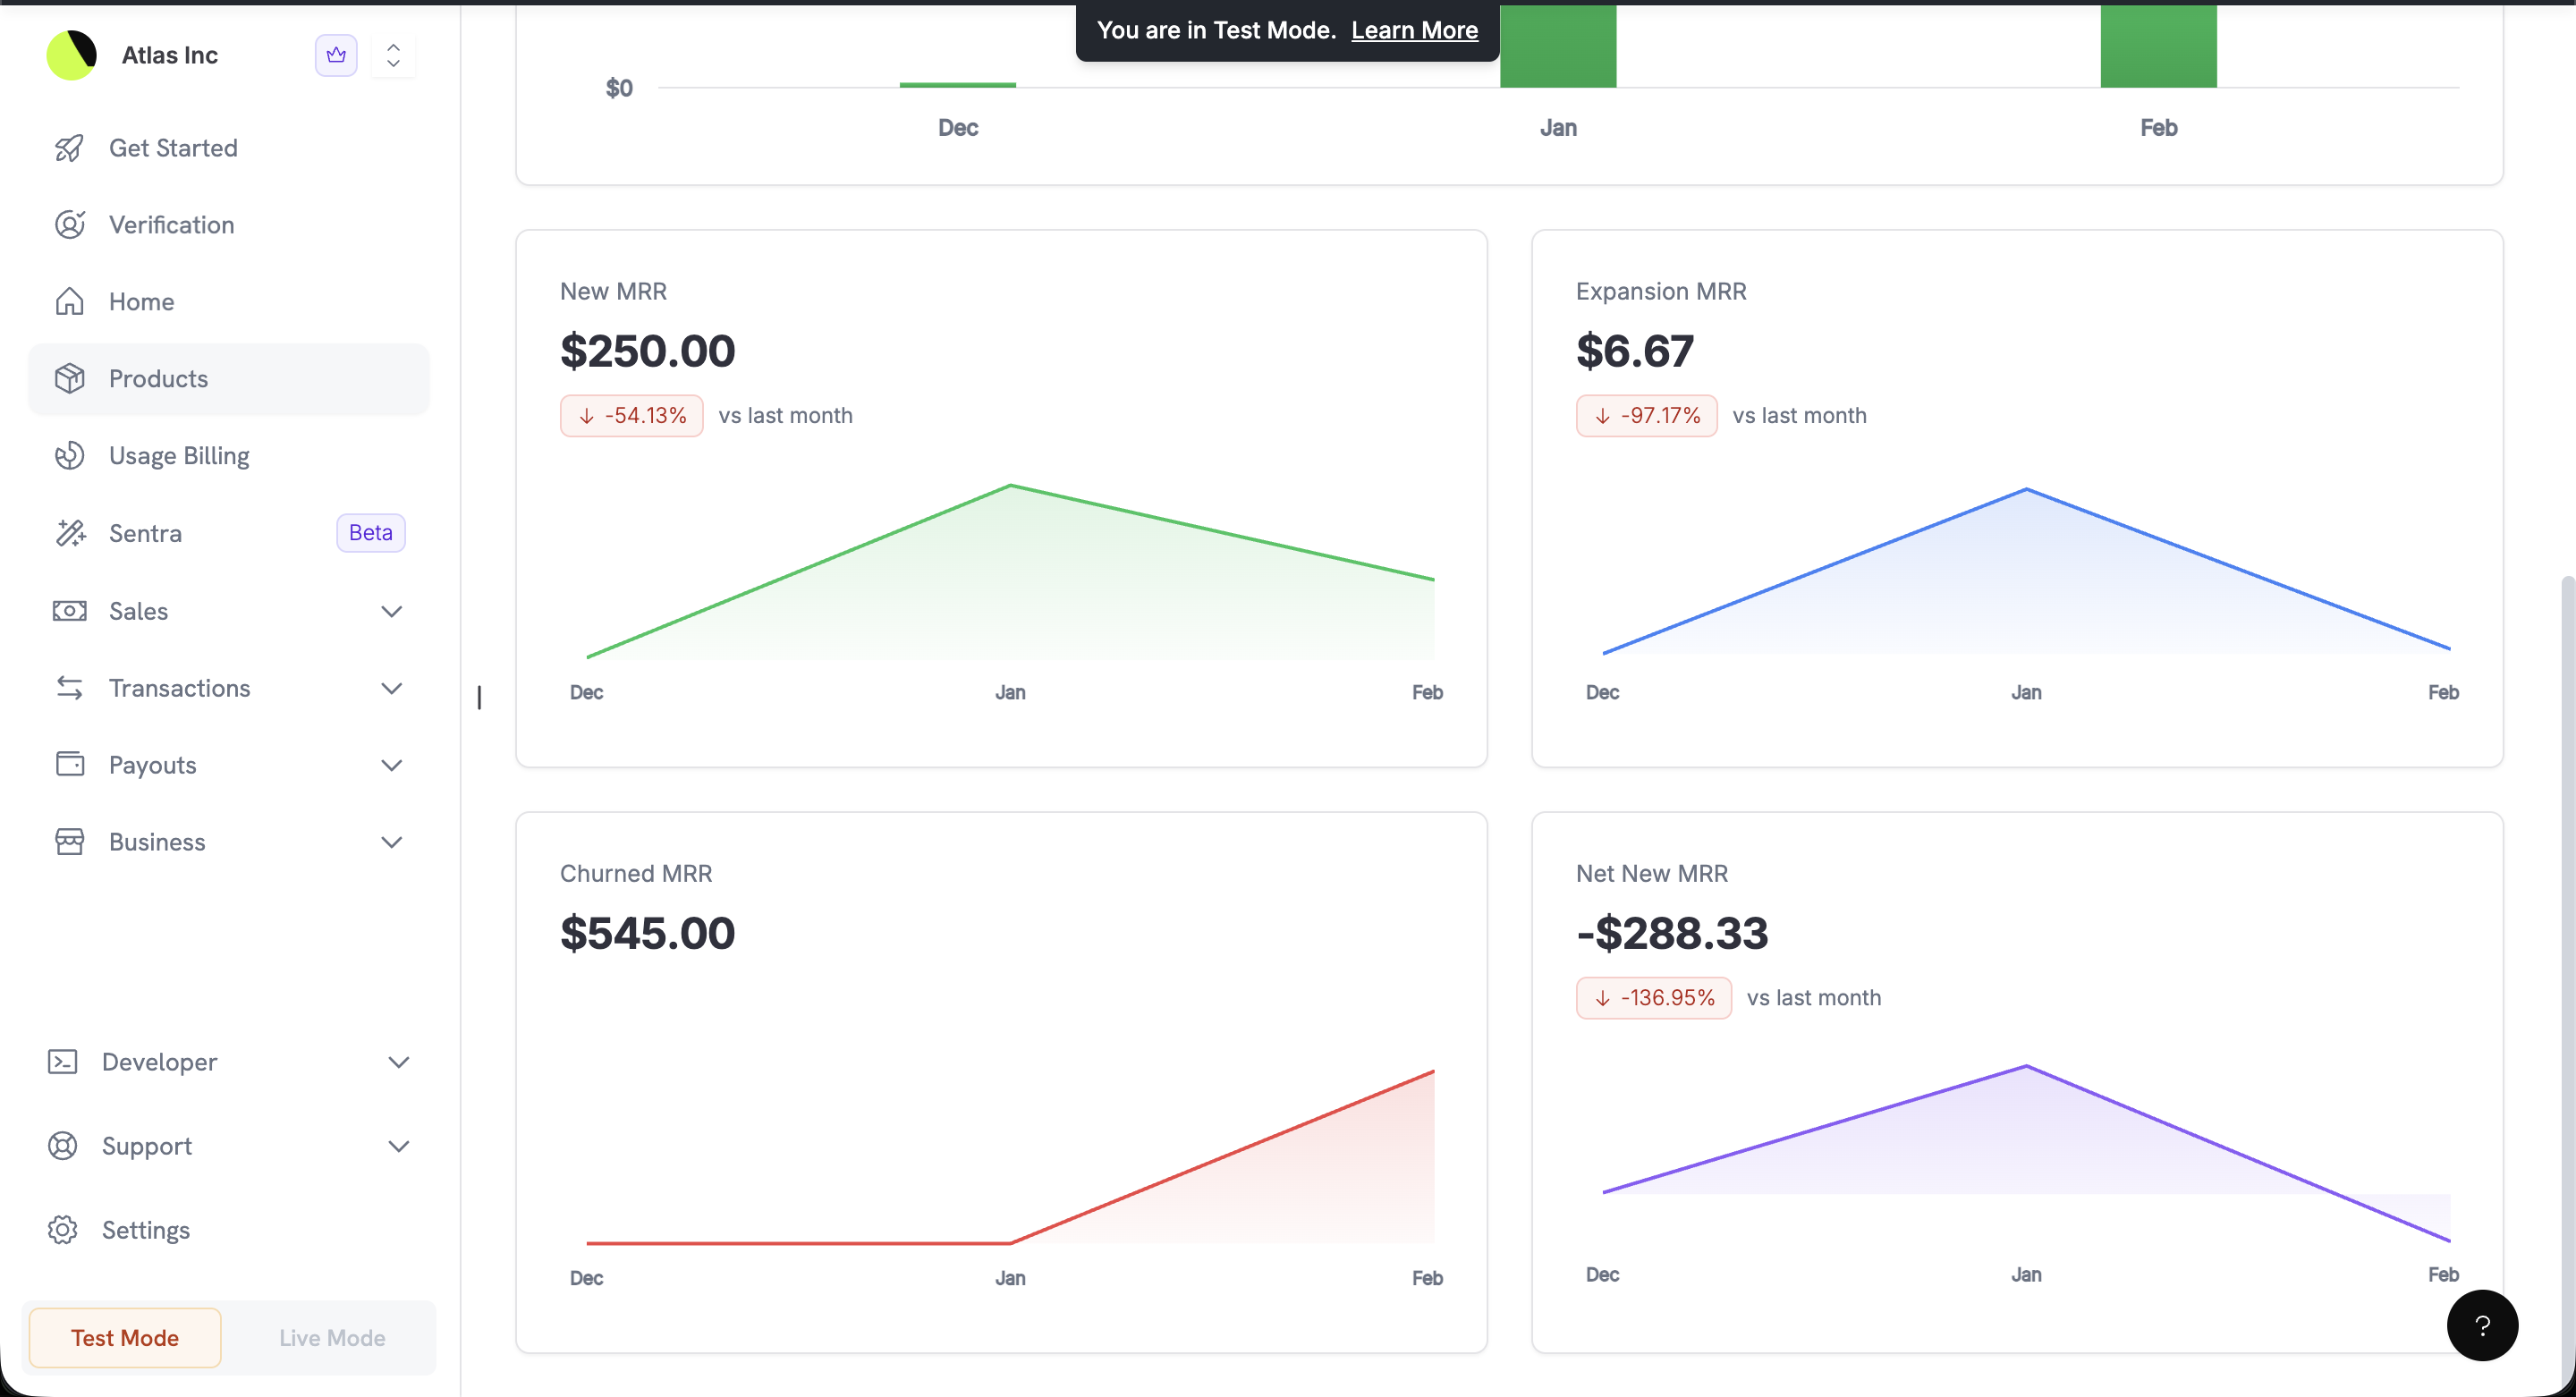
MRR chart आपके recurring revenue composition को month-by-month stacked bar chart के रूप में visualize करता है। Chart के नीचे metric cards detailed insights प्रदान करते हैं:
MRR breakdown showing New MRR, Expansion MRR, Churned MRR, and Net New MRR with trend charts

Detailed MRR breakdown with New, Expansion, Churned, and Net New MRR

प्रत्येक card में trend mini-chart और previous month की तुलना में percentage change indicator शामिल होता है।

Page Highlight Tiles

आपके dashboard के कई list pages अब सबसे ऊपर highlight tiles दिखाते हैं, जो full Analytics dashboard खोले बिना key summary metrics तुरंत उपलब्ध कराते हैं। Tiles page के active filters का पालन करते हैं।
“Active” products, add-ons, collections और meters वे हैं जिन्होंने कम से कम एक successful payment में भाग लिया है।

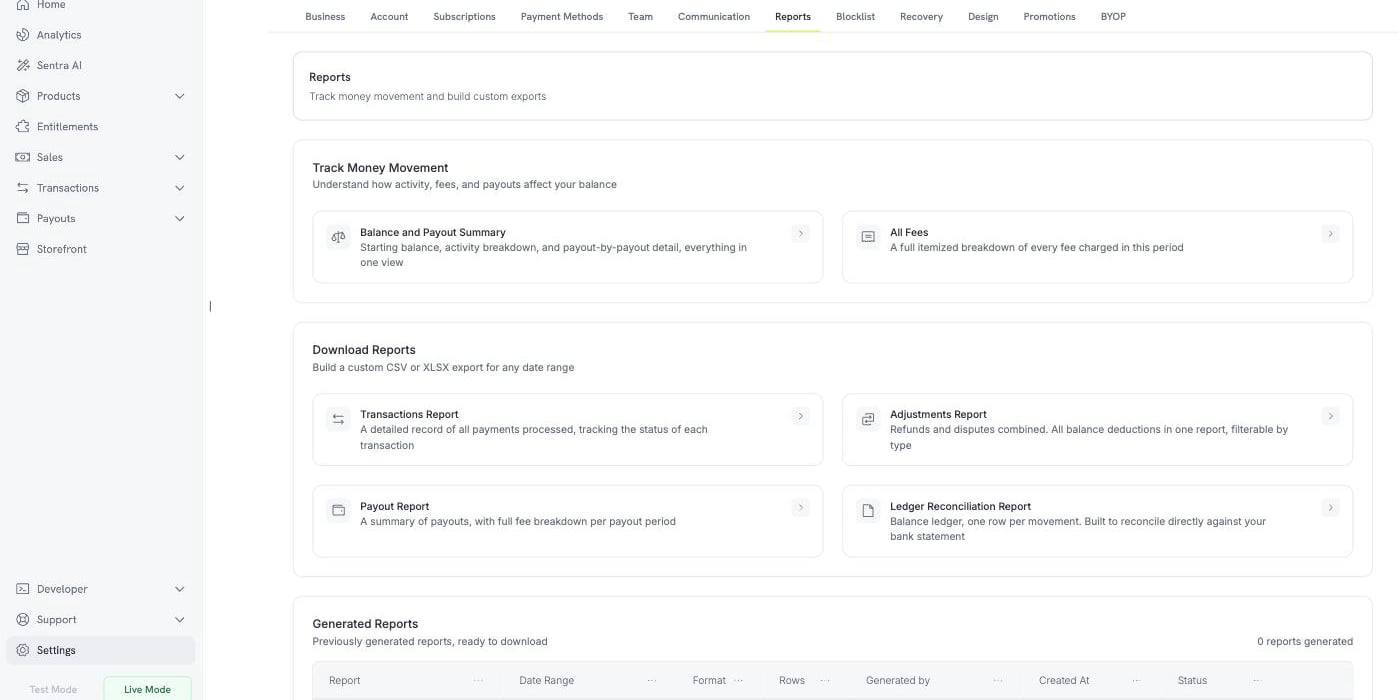
Reports

प्रत्येक report के संबंधित page पर Build Report button होता है। अपनी आवश्यक report access और download करने के लिए relevant section पर जाएँ। प्रत्येक report को (जहाँ लागू हो, payment method, status, product type, failure type, dispute status या currency के आधार पर) filter किया जा सकता है और CSV के रूप में download किया जा सकता है।
Create a Payment Report modal showing time period selection and payment method filters

Create a Payment Report with time period and filter options

Downloading Reports

1

Navigate to the relevant page

ऊपर दी गई table का उपयोग करके अपनी आवश्यक report के page पर जाएँ।
2

Select a time period

Build Report पर click करें और preset range (Today, Last 7 days, Last 30 days, This month आदि) चुनें या calendar का उपयोग करके custom date range चुनें।
3

Download

Download Report पर click करें। Report CSV के रूप में export होकर आपके device में save हो जाएगी।
Fee data standalone report के रूप में उपलब्ध नहीं है। Fees (payment fees, refund fees और payout fees) का breakdown Payouts → Balances के अंतर्गत Account Summary Report में filter options के रूप में उपलब्ध है।

Best Practices

  • Trends और anomalies को जल्दी पहचानने के लिए अपने analytics की नियमित रूप से समीक्षा करें।
  • Products, time periods या geographies के बीच performance की तुलना करने के लिए filters का उपयोग करें।
  • यह समझने के लिए product-level analytics में गहराई से जाएँ कि कौन से products सबसे अधिक revenue generate करते हैं और किनका churn सबसे अधिक है।
  • यदि data incorrect या missing दिखाई दे, तो पहले अपने filters और date range settings जाँचें।
यदि आपको लगातार discrepancies या missing data दिखाई दे, तो सहायता के लिए support@dodopayments.com से contact करें।

Next Steps

Account Summary & Payout Wallet

अपनी earnings, deductions और payout cycles को समझें।

Products

अपने products create और manage करें।

Payments

सभी payment transactions को track और manage करें।

Refunds

Refunds शुरू और monitor करें तथा refund reports export करें।
अंतिम संशोधन 8 अगस्त 2026