


はじめに
ダッシュボードの分析では、収益、顧客、サブスクリプション、リテンション、決済成功率、回収済み収益など、ビジネスのパフォーマンスを確認できます。ホームでは、毎日の状況をすばやく確認できます。分析にはすべての指標がまとまっており、期間、比較対象、製品でフィルタリングできます。Home
Business Analytics
Product-Level Analytics
Page Highlight Tiles
Reports
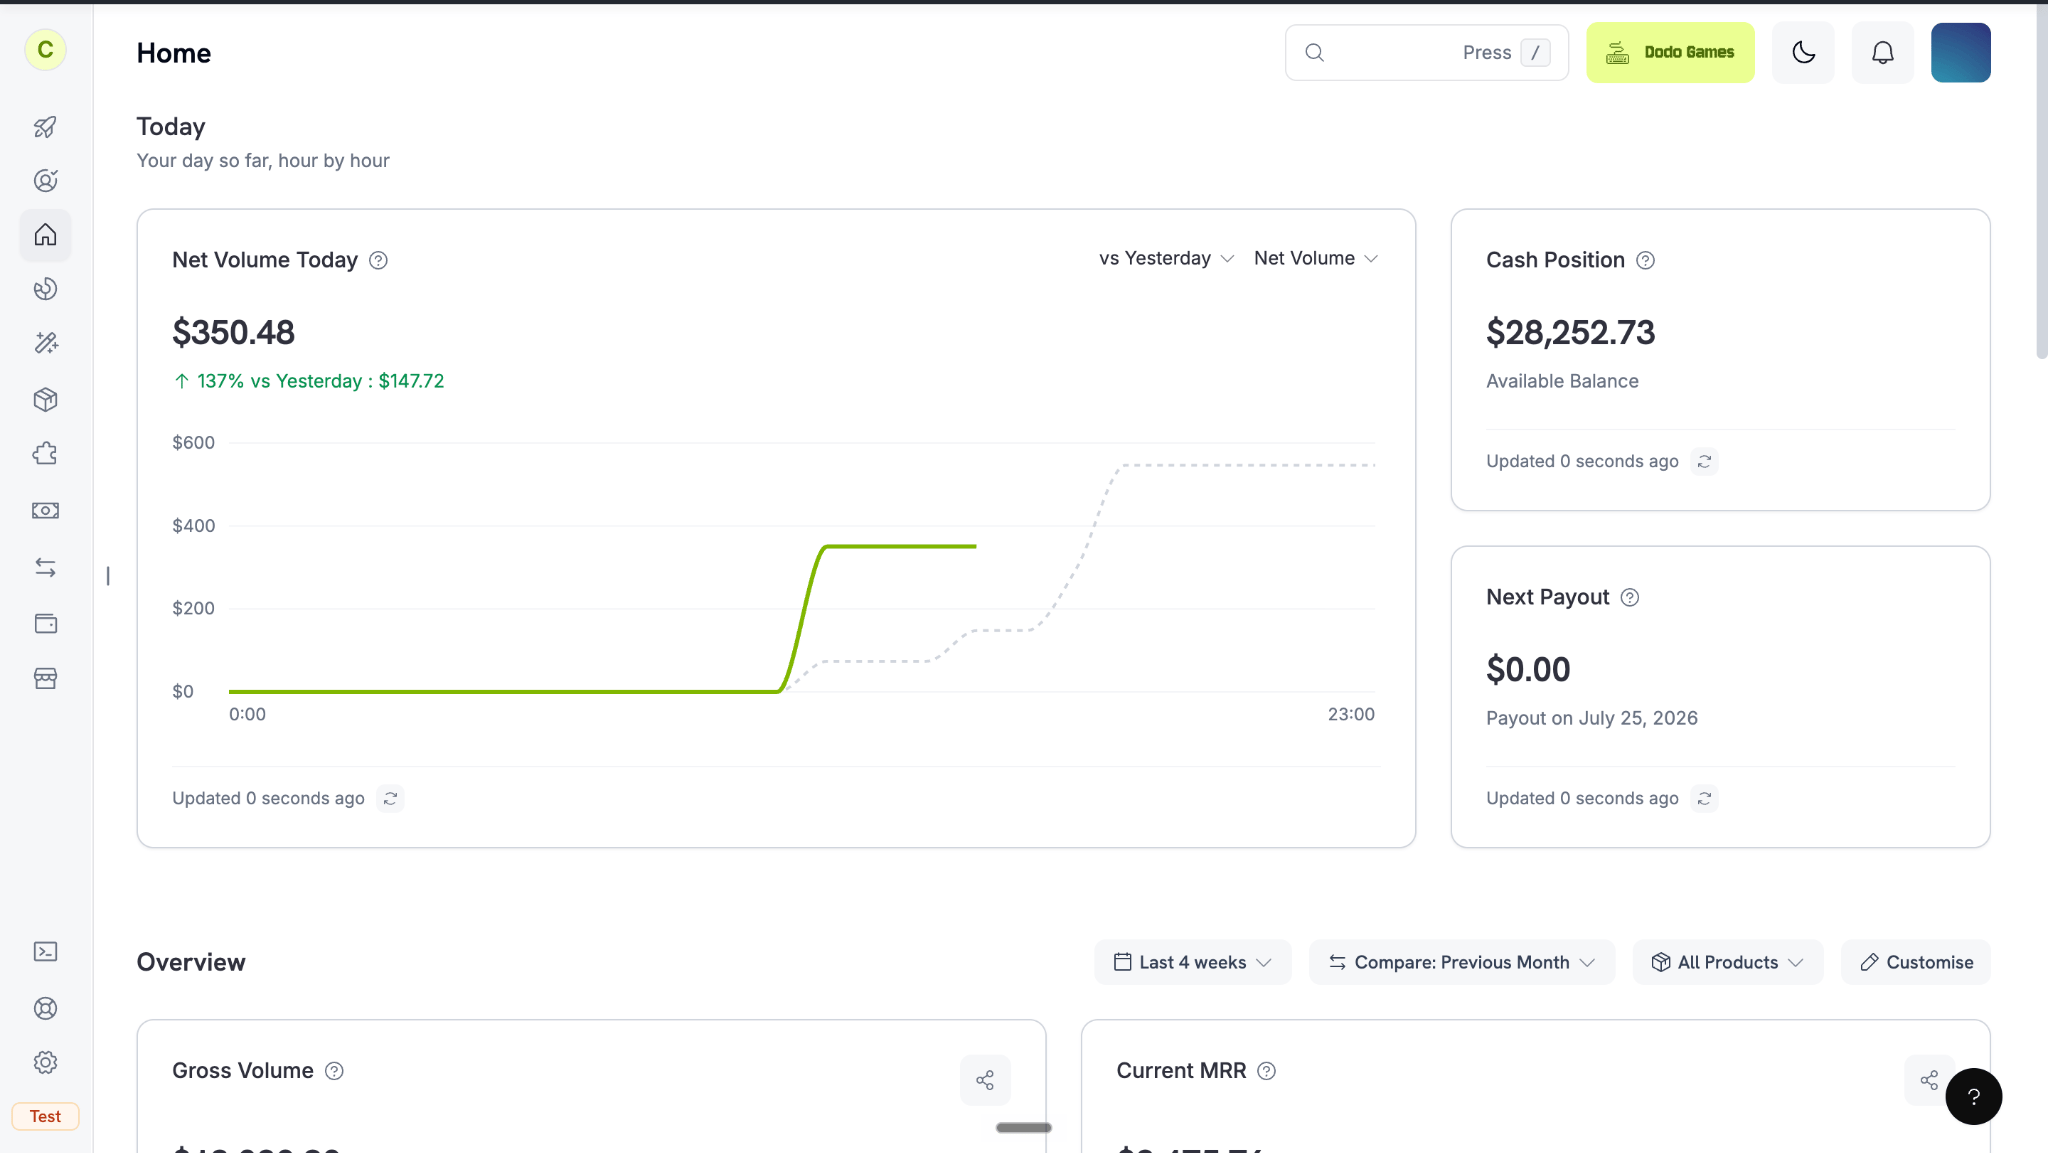
The Home dashboard: a daily pulse plus a customizable overview
ホーム
ホームはサイドバーのランディングページです。今日と概要の2つのセクションがあります。今日
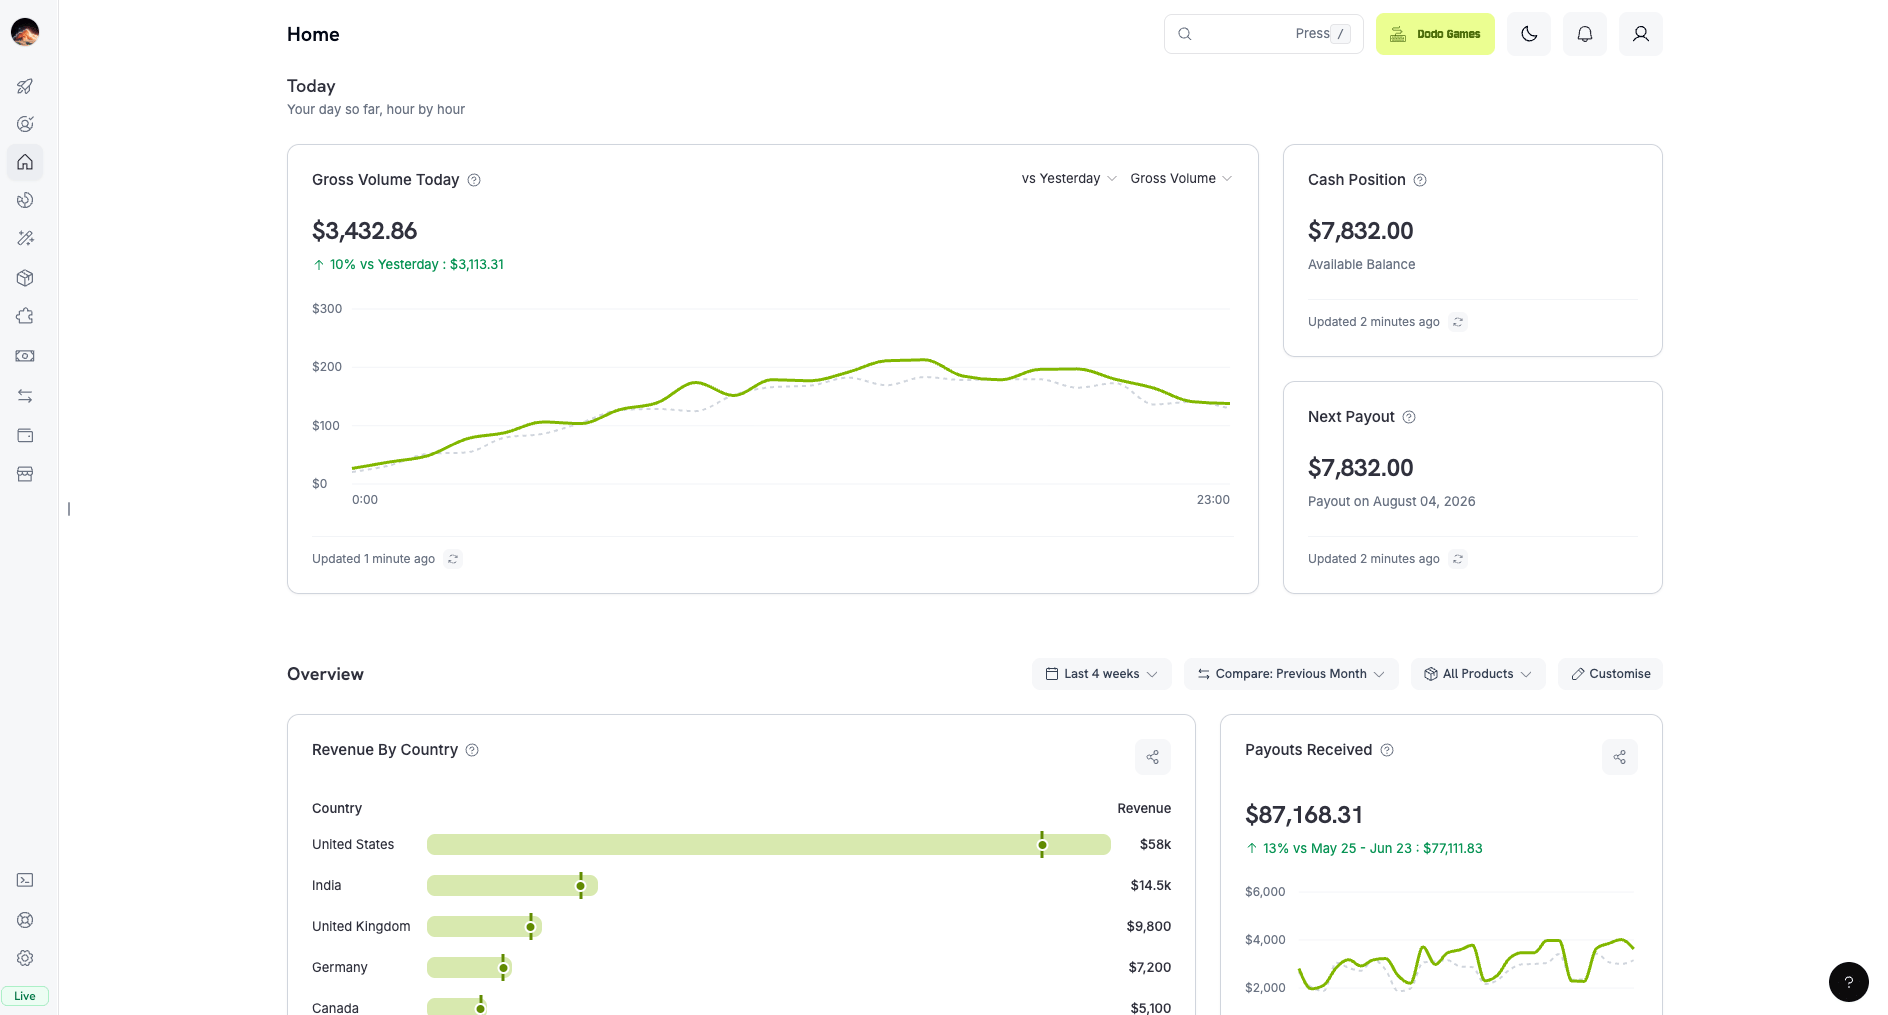
Today: your day's pulse, hour by hour
- ヘッドラインチャート: Net VolumeとGross Volumeを切り替えます。デフォルトはNet Volumeで、各時間の値を前日の同じ時間と比較して表示します。別の日と比較するには、日付を選択します。
- キャッシュポジション: 残高で利用できる資金です。現在のモードに従うため、テストモードとライブモードでは異なる残高が表示されます。
- 次回の支払い: 次回の支払い金額と日付です。テストモード中であっても、常にライブモードのデータが表示されます。
概要
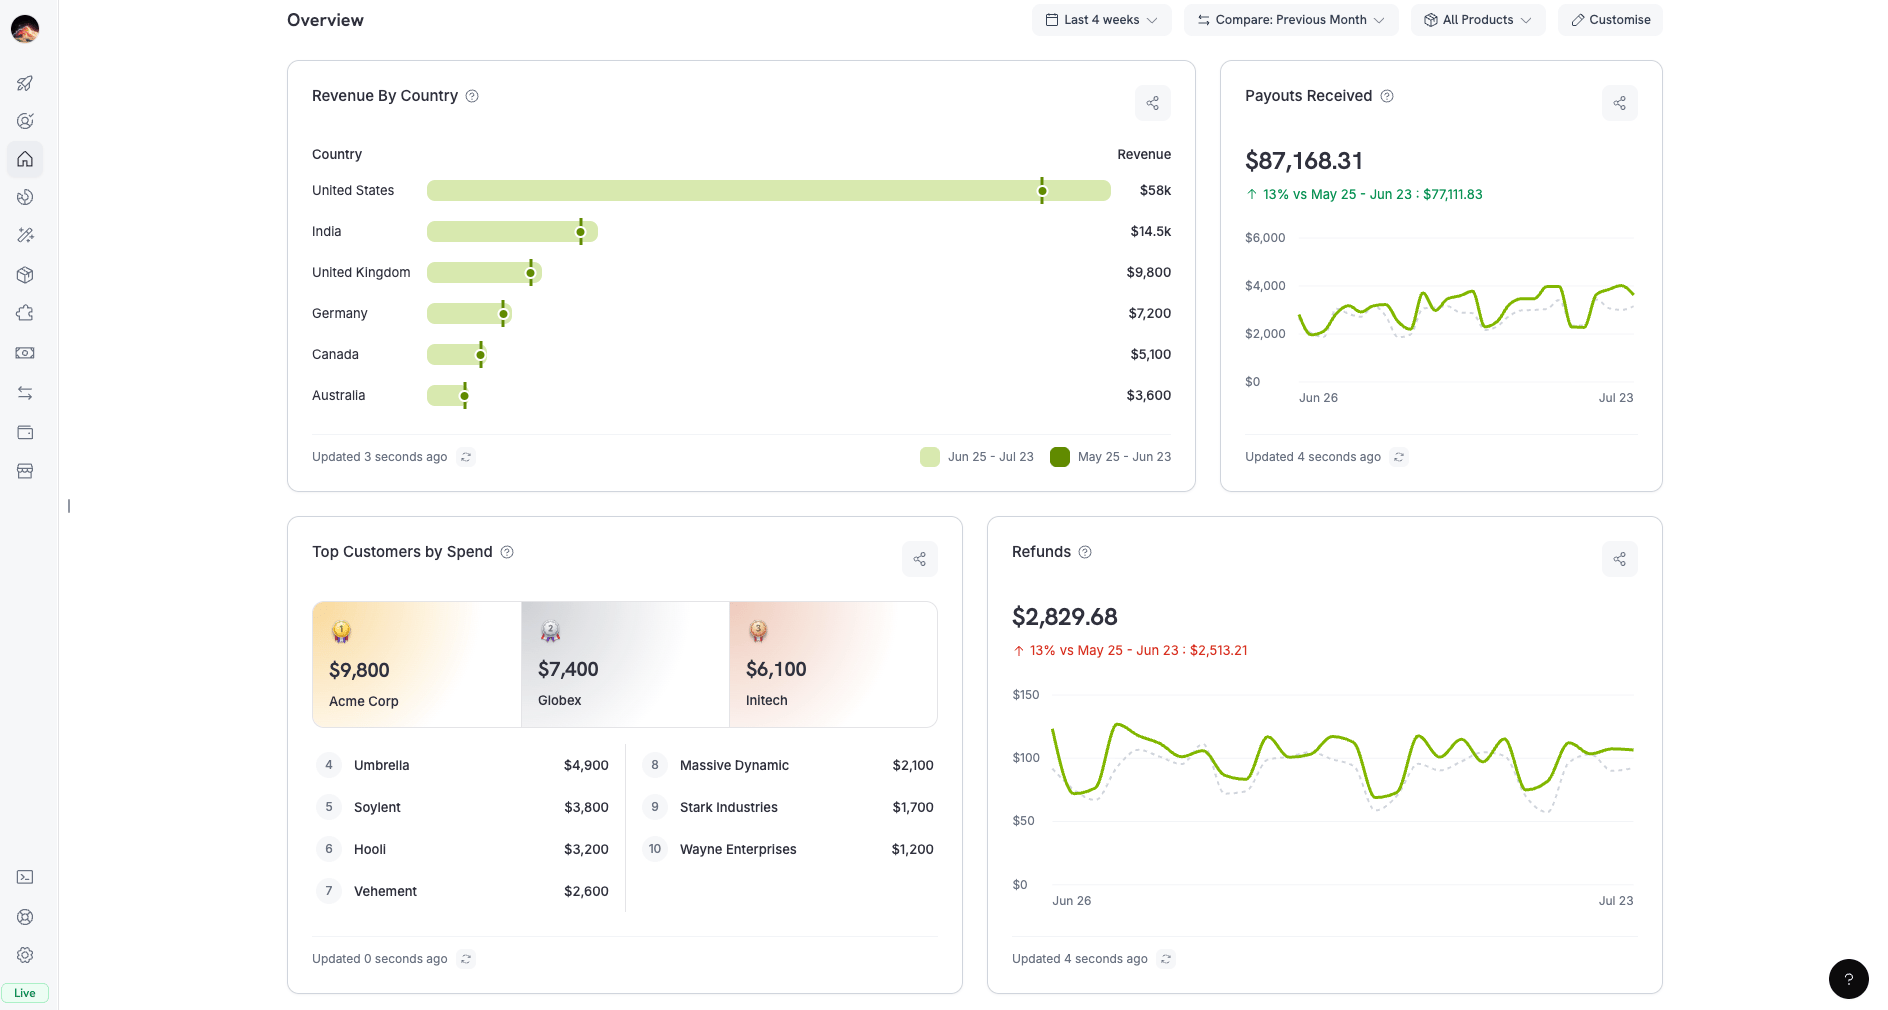
Your overview: a fully customizable set of metric cards
- デフォルトカード: Gross Volume、Net Volume、返金、新規顧客、支出額上位の顧客、平均注文額、国別収益、決済成功率。
- コントロール:
- 期間: 過去30日間などのプリセット範囲、またはカスタム日付範囲。
- 比較: 前の期間(デフォルト)、前週、前月、前年。
- 製品: 1つ以上の製品。デフォルトはすべての製品。
分析
サイドバーのホームのすぐ下にある分析を開くと、ビジネス全体を分析できます。6つのタブがあり、各タブに独自のフィルターがあります。Revenue
Customers
Subscriptions
Retention
Success Rate
Recovery
フィルタリングとカスタマイズ
各タブには、3つのコントロールを備えたフィルターバーがあります。- Time Period: プリセット範囲(Today、Last 7 days、Last 30 days、Month to date、Quarter to date、Last 6 months、または All time)またはカスタム日付範囲。新しいダッシュボードは Last 30 days から開始します。
- Compare: Previous Period(デフォルト)、Previous Week、Previous Month、または Previous Year。比較対象となる過去の期間がないため、All time では比較を利用できません。
- Product: 複数選択。デフォルトは All Products です。Revenue、Customers、Subscriptions、Retention タブをフィルタリングします。Payouts Received、Refunds、Disputes、およびほとんどの Success Rate と Recovery のカードは、常にすべての product を対象とします。
収益タブ
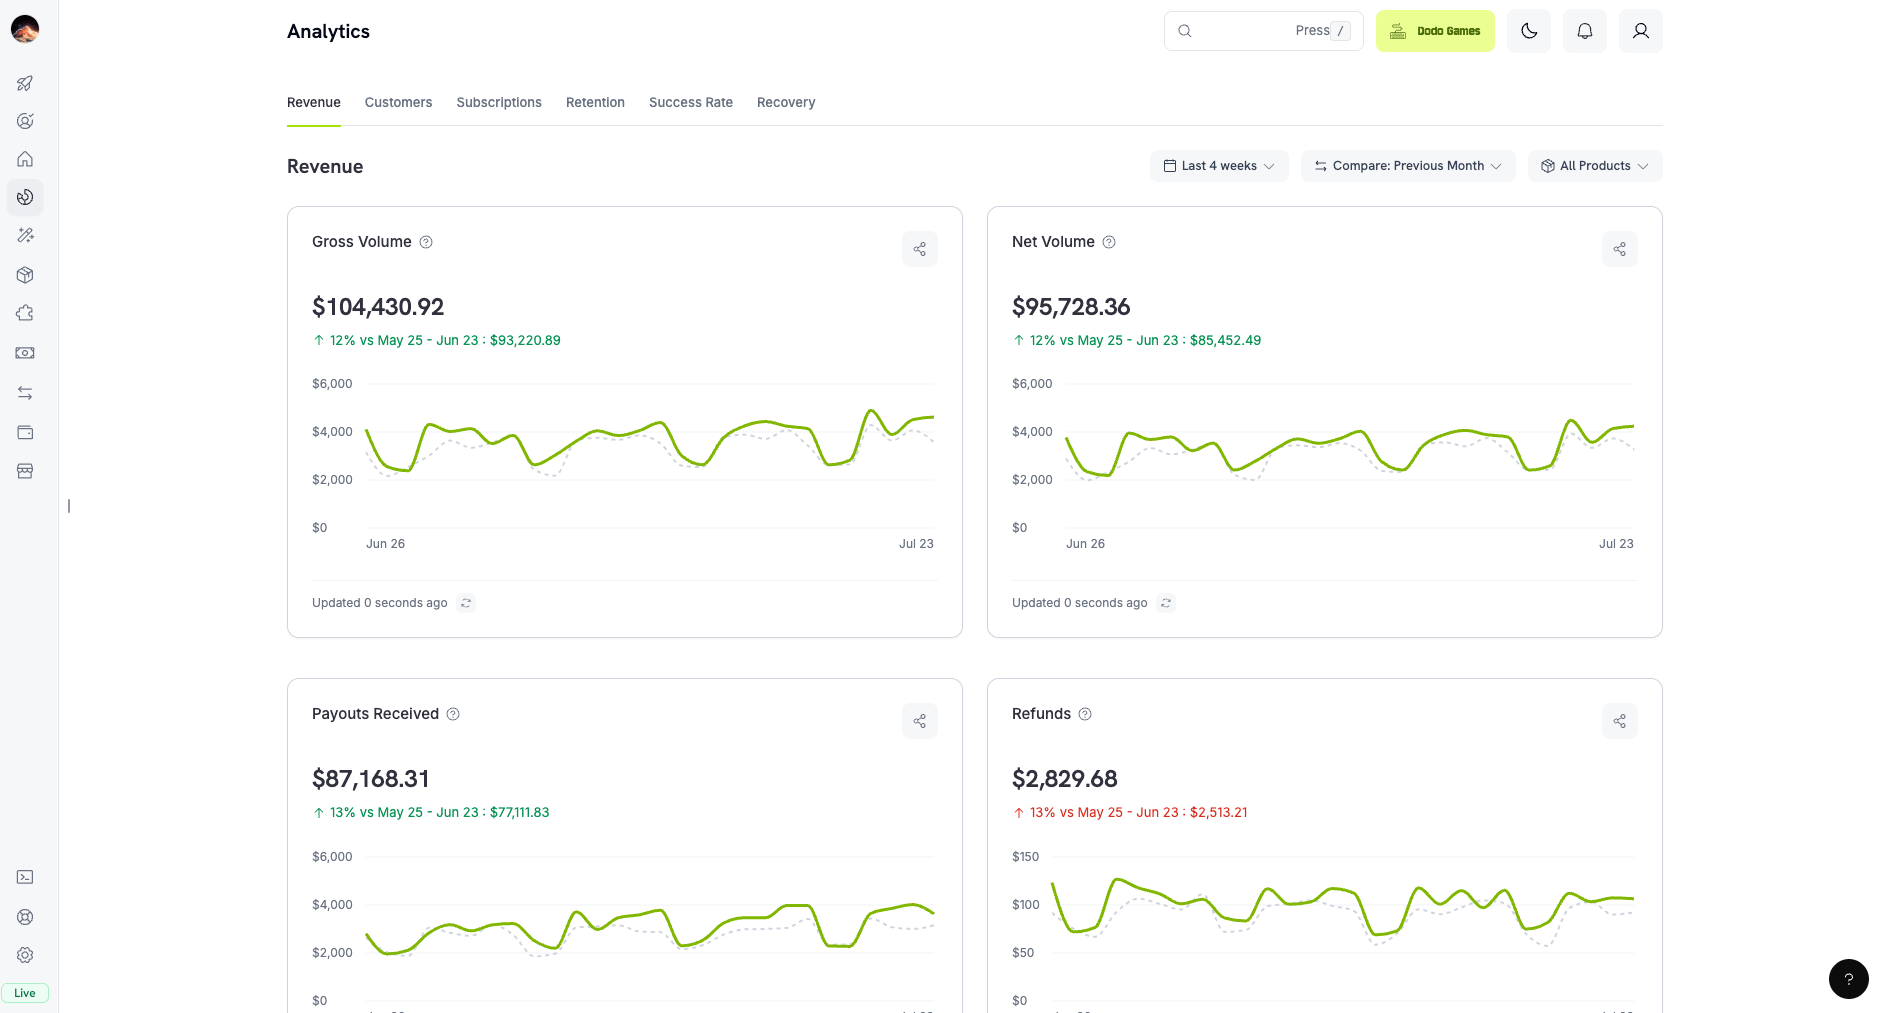
Revenue tab: gross/net volume, payouts, and refunds
Customers Tab
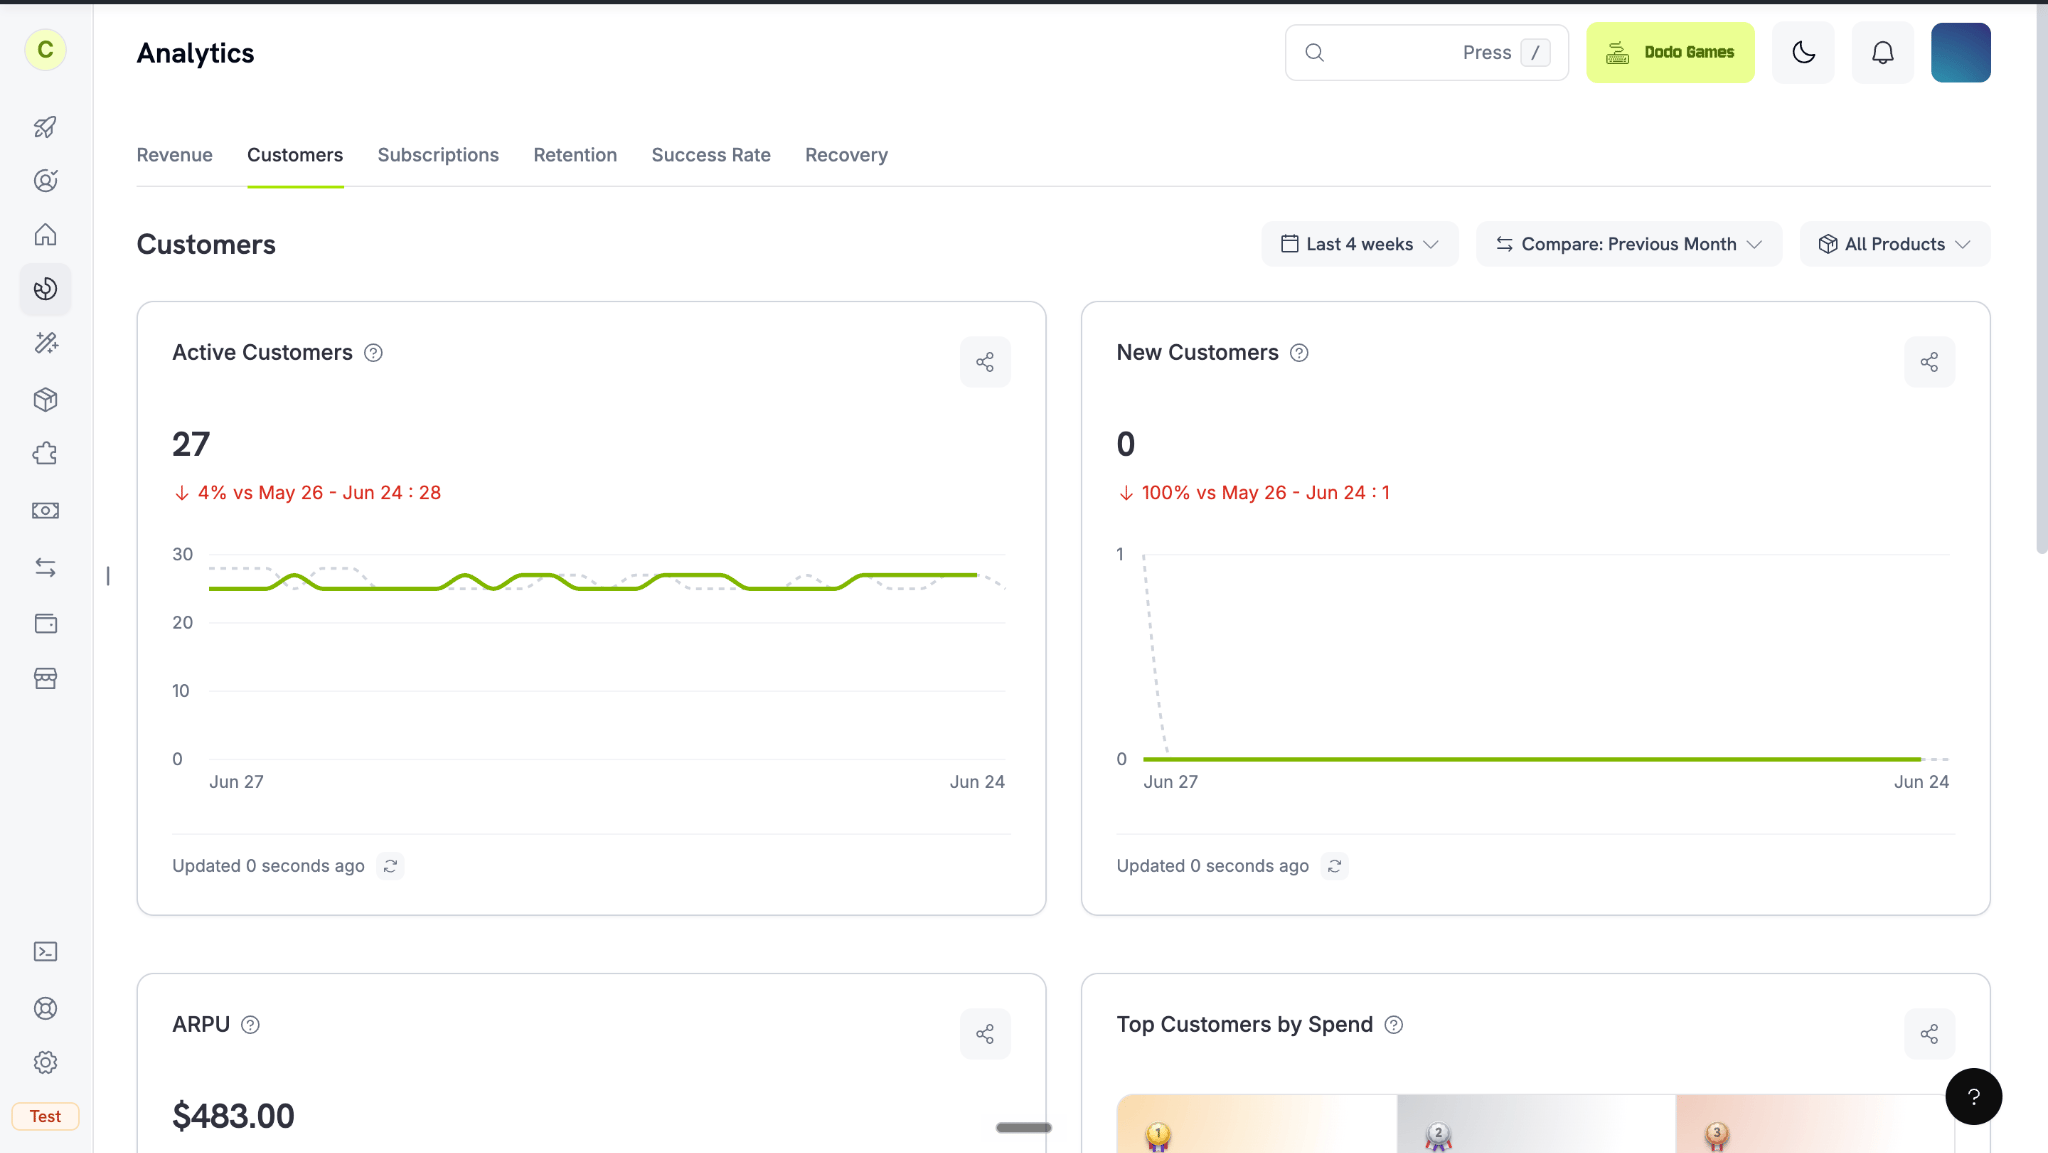
Customers tab: active and new customers, ARPU, and top customers
Subscriptions Tab
Recurring revenue を監視し、Monthly Recurring Revenue (MRR) が時間とともにどのように変化するかを確認します。Retention Tab
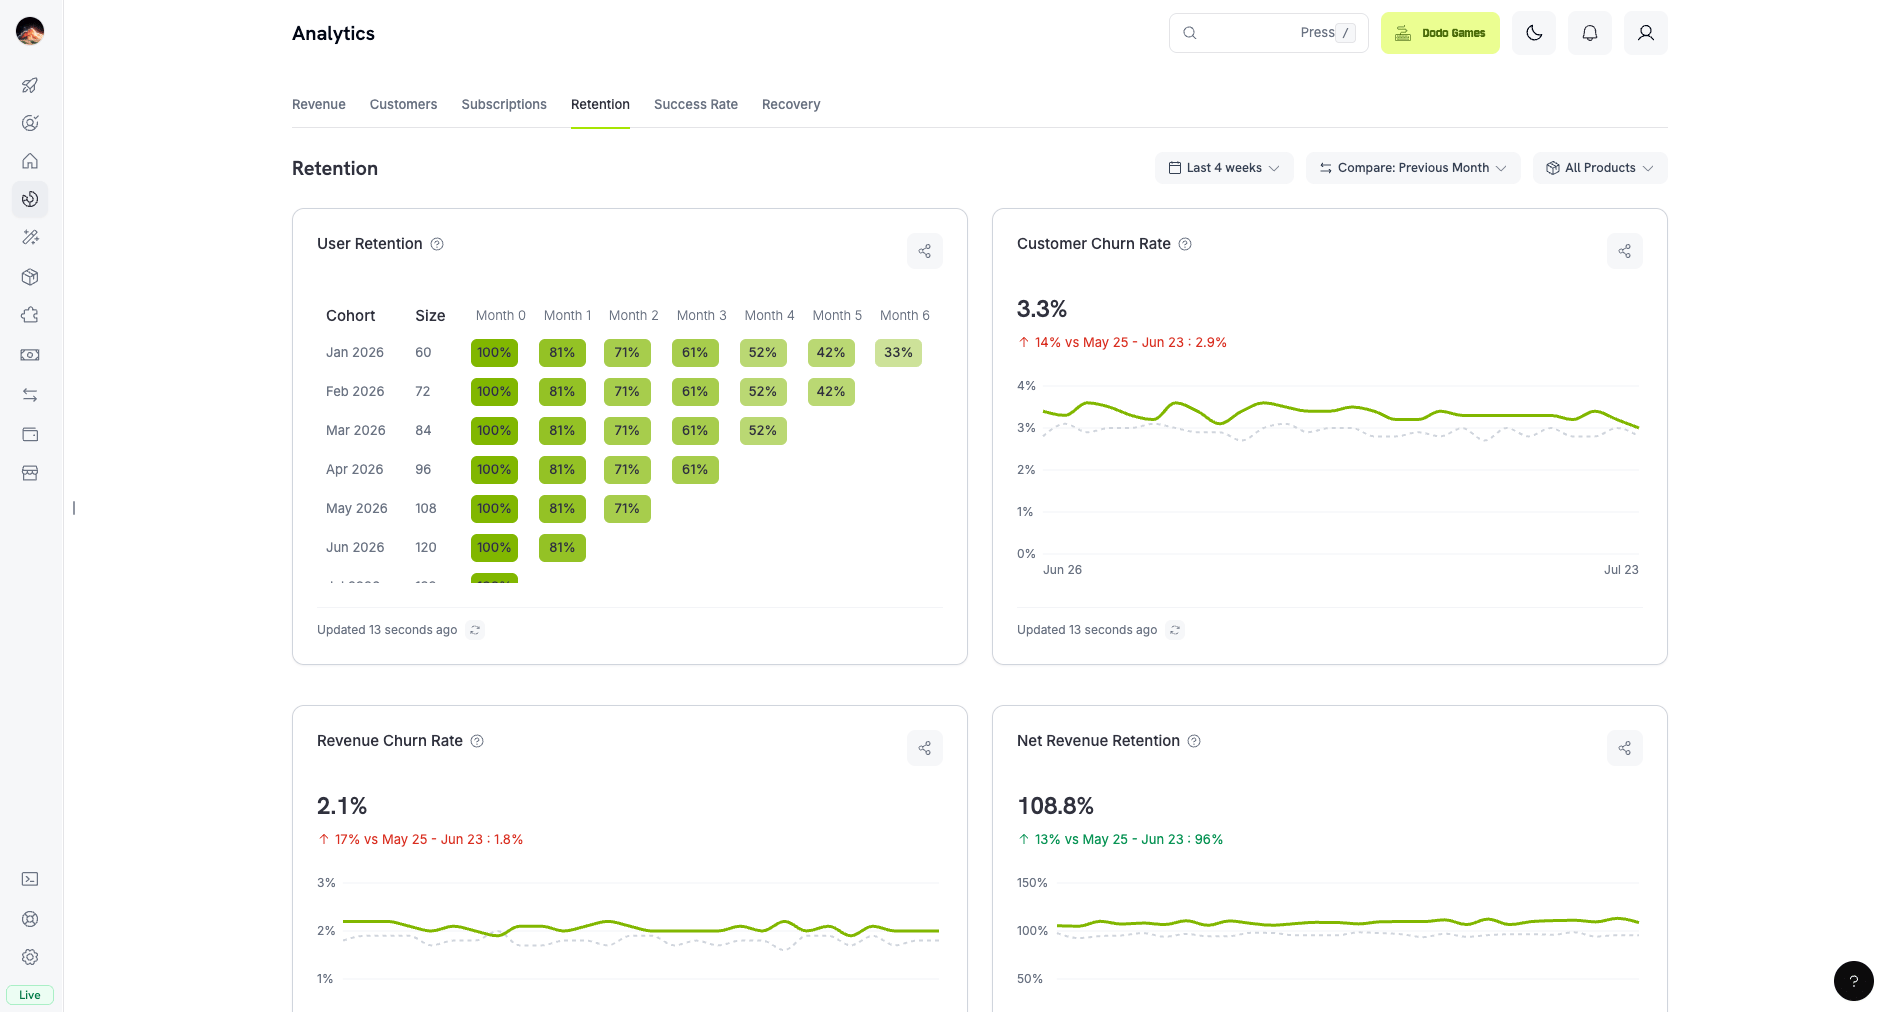
Retention tab: churn rates, retention matrix, and NRR/GRR
Success Rate Tab
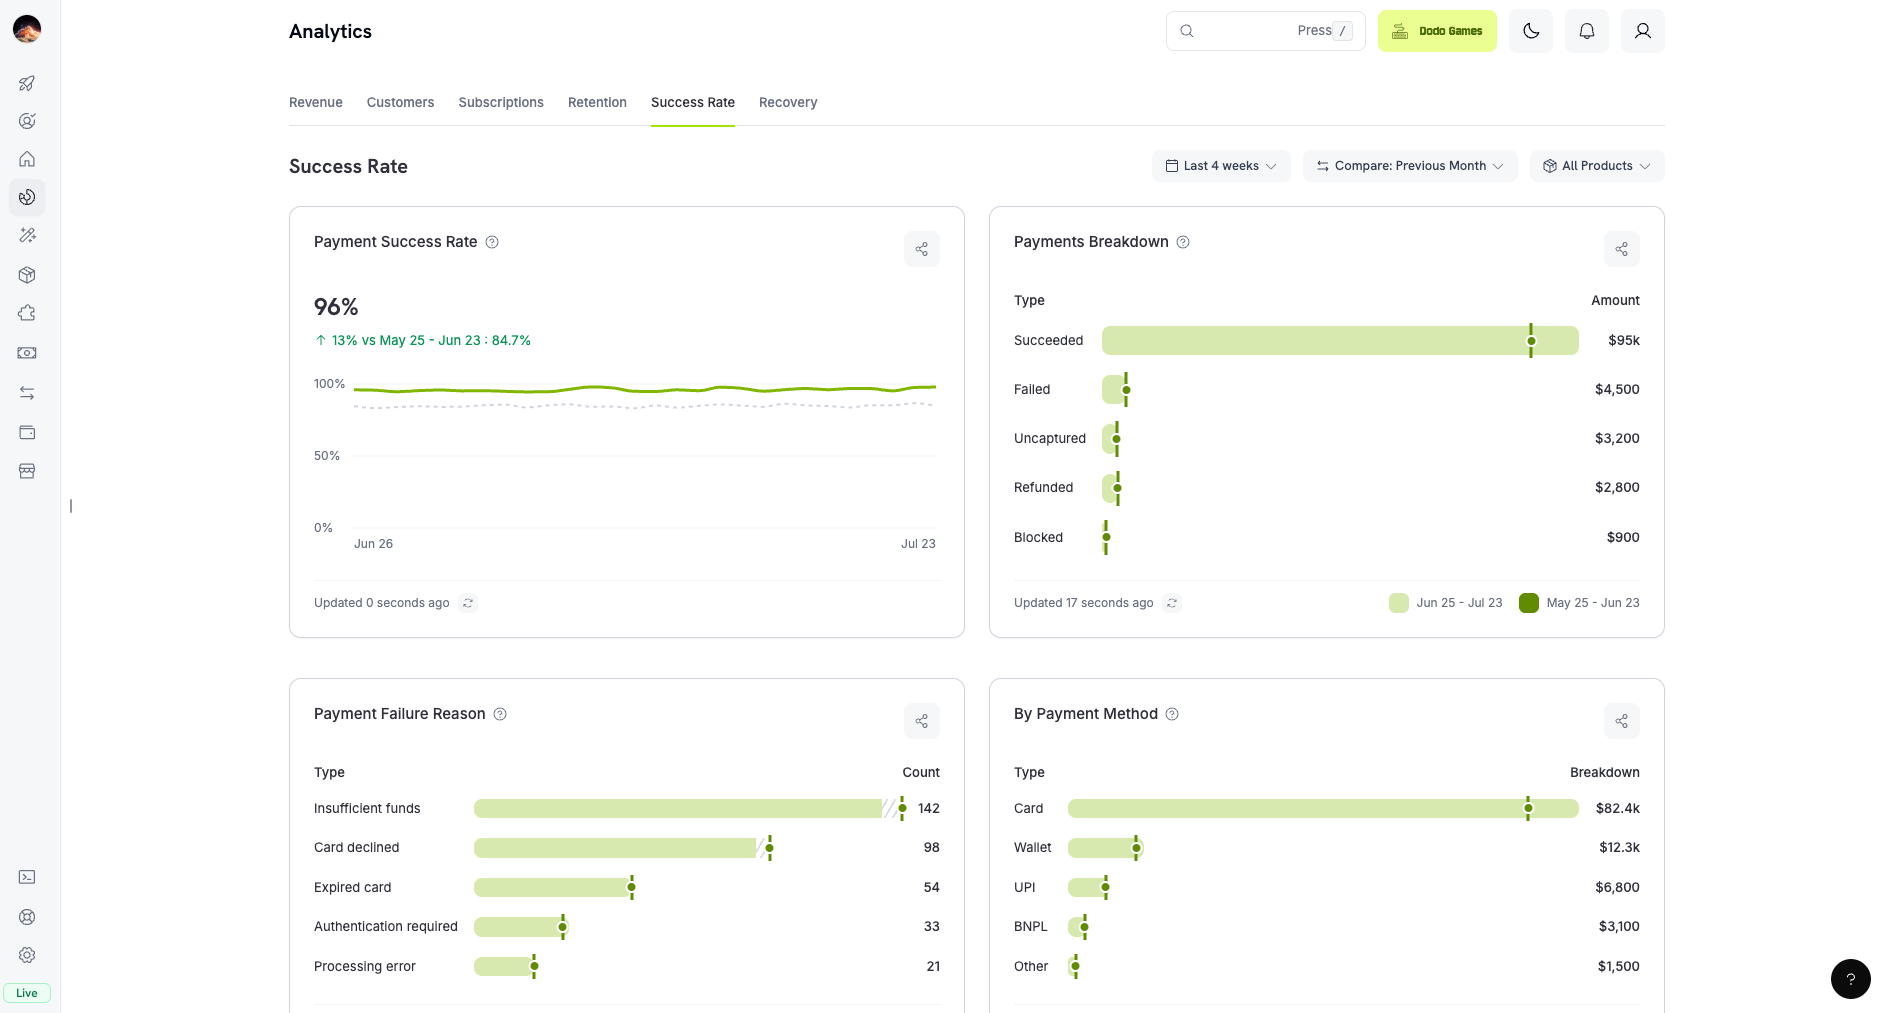
Success Rate tab: payment and refund success rates with failure analysis
Transaction Failure Reference
Recovery Tab
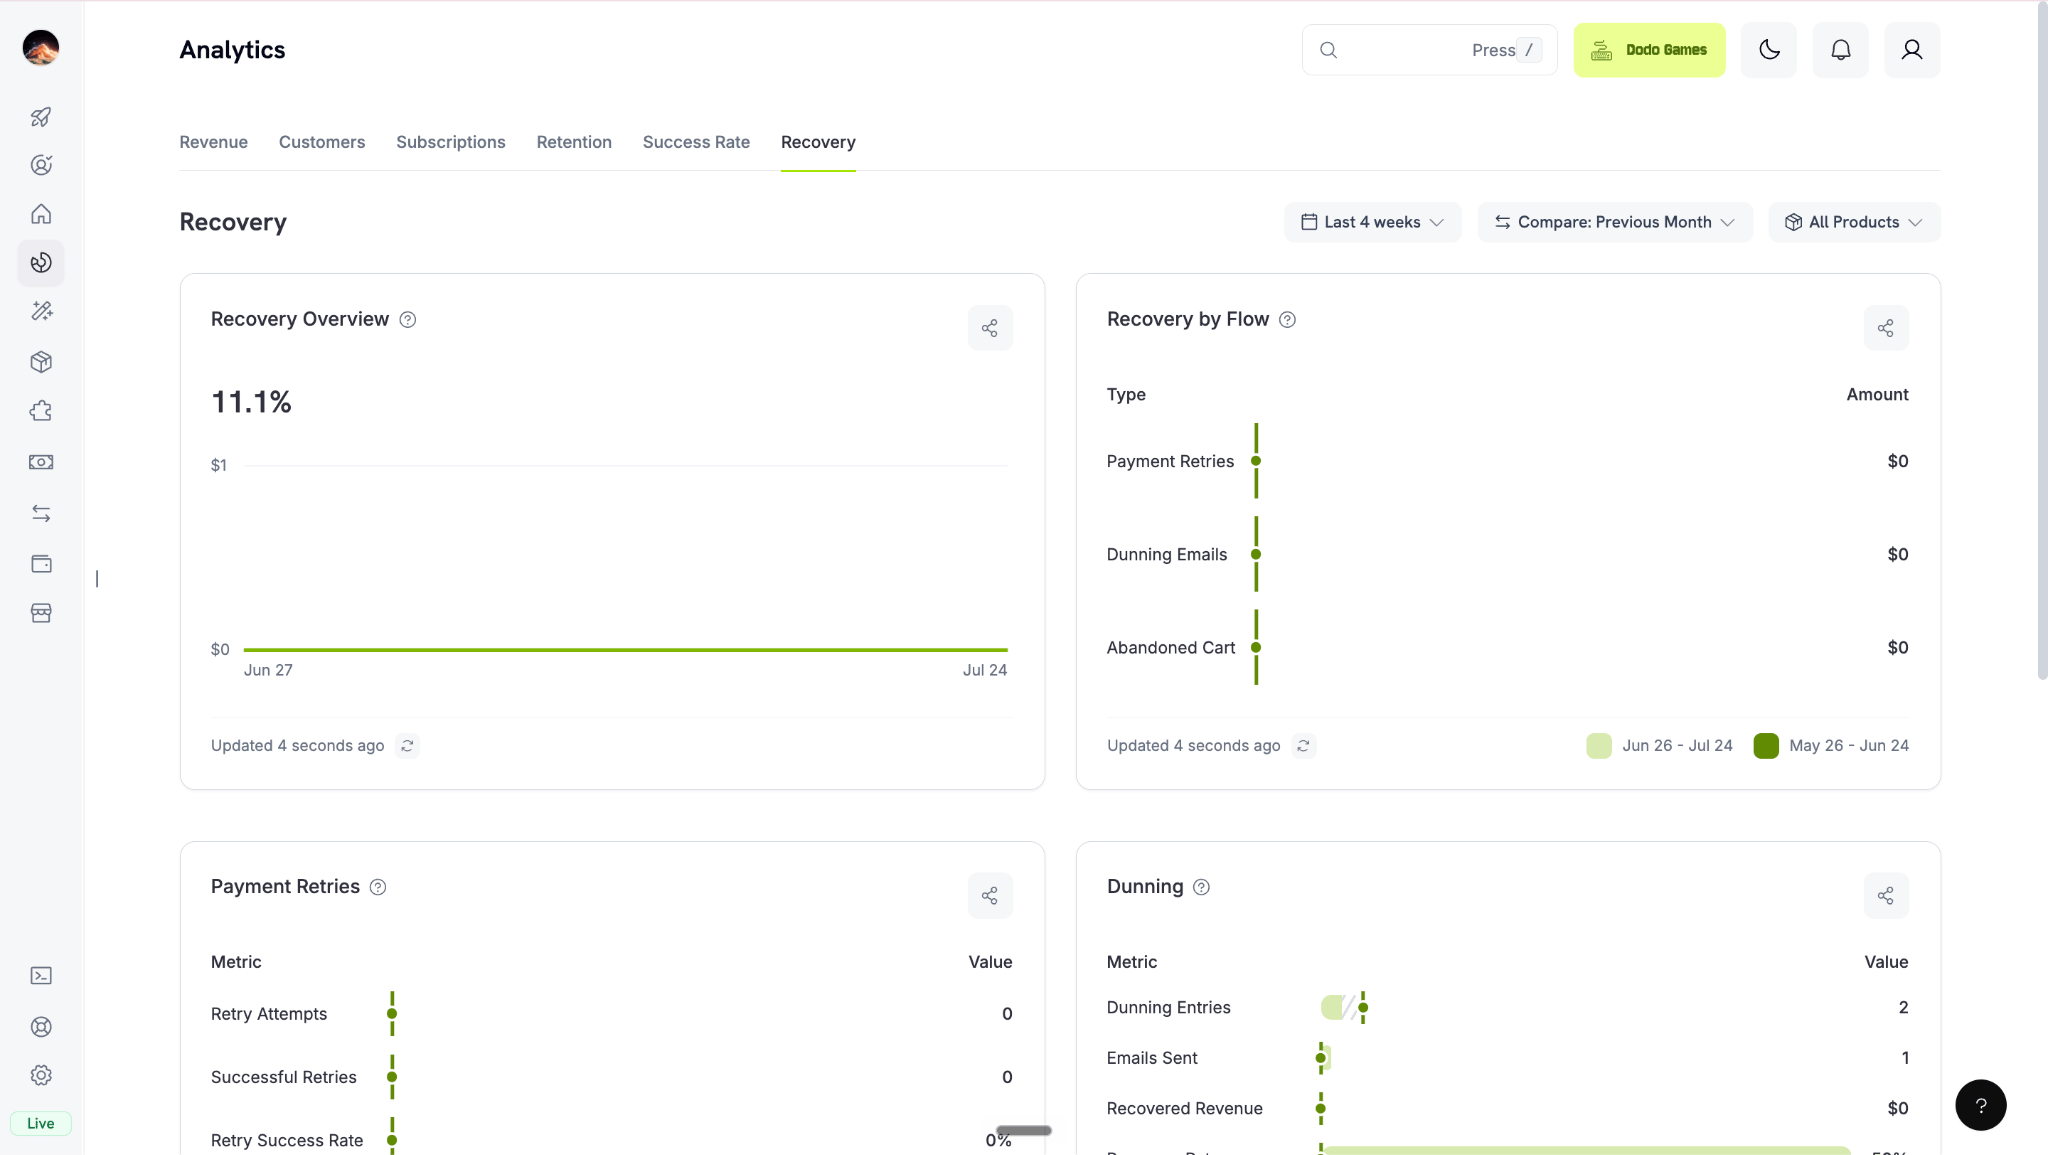
Recovery tab: retries, dunning, and abandoned cart recovery
Recovery Features
Product-Level Analytics
1つの product の analytics を確認するには、Products に移動して product を選択します。product page には、その product に限定された Analytics と同じカードが表示されます。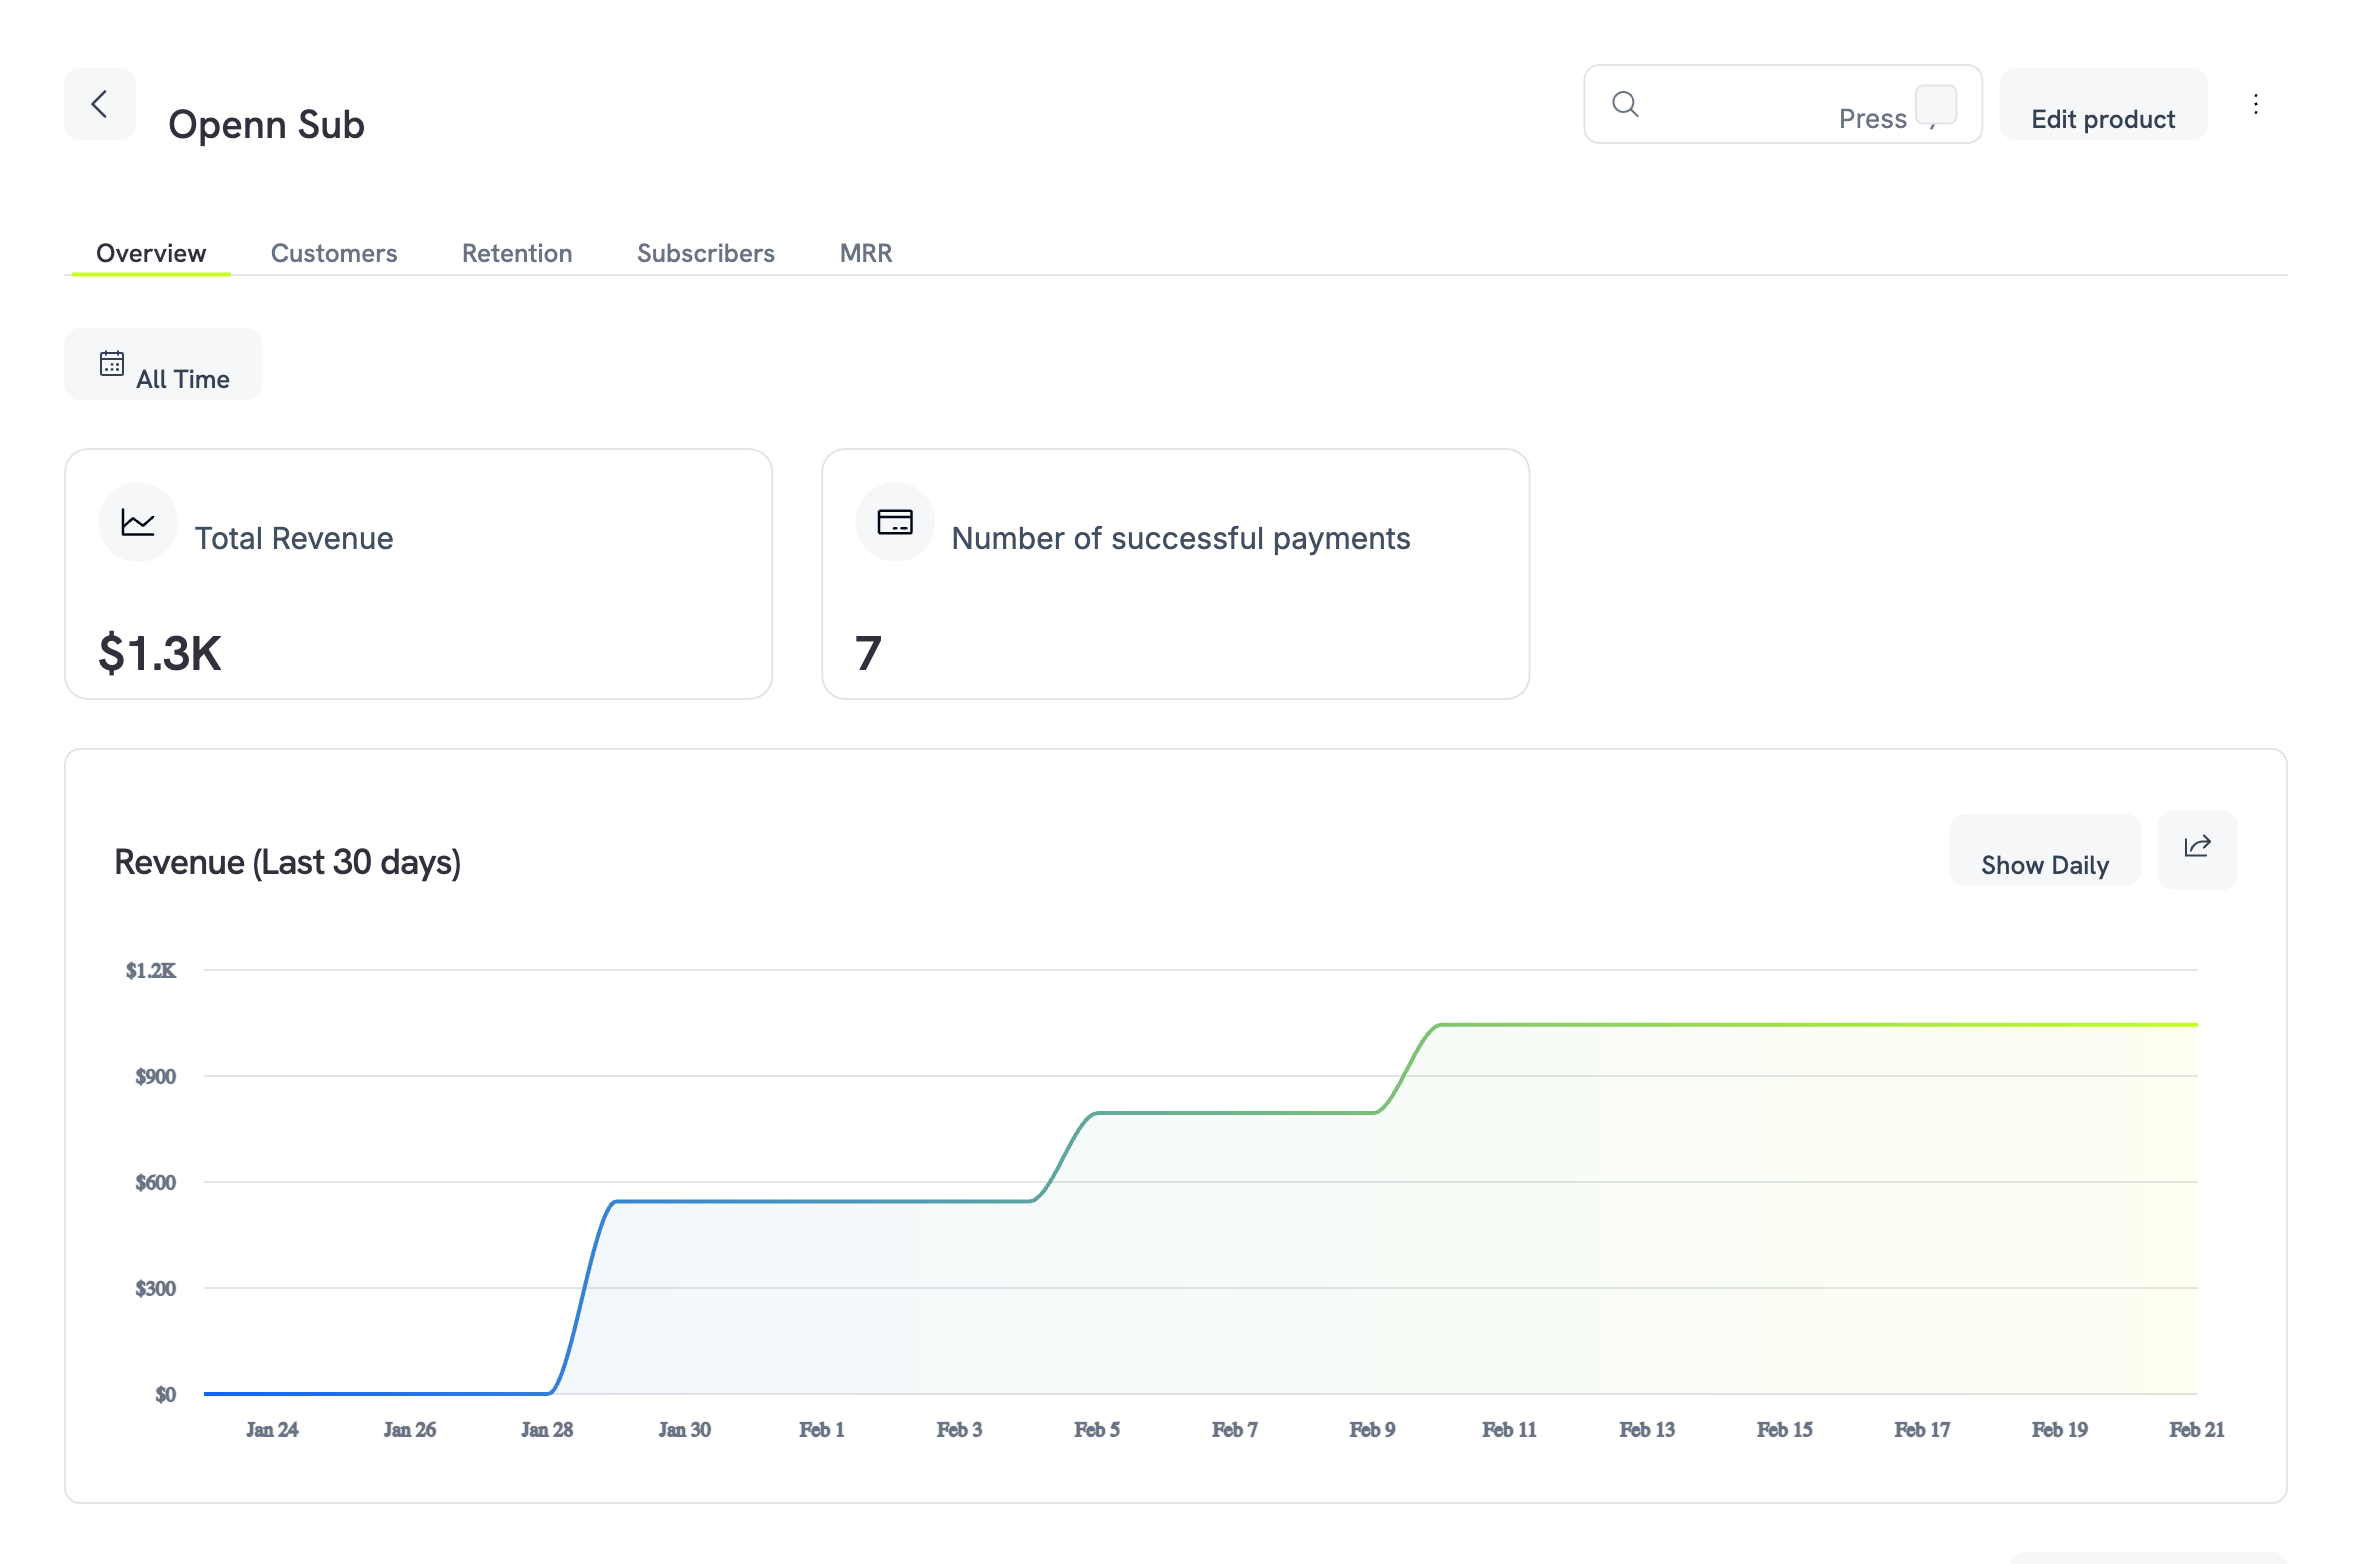
Product analytics overview showing revenue summary and trend chart
Overview
Customers
Retention
Subscribers
MRR
Overview Tab
Overview tab には product の Revenue card、つまり Gross Volume、Net Volume、Payments Count、Payments Breakdown、Average Order Value、Revenue By Country が表示されます。各 metric の定義は Revenue Tab を参照してください。 カードの下には、この product のすべての payment を一覧表示する Transactions table があります。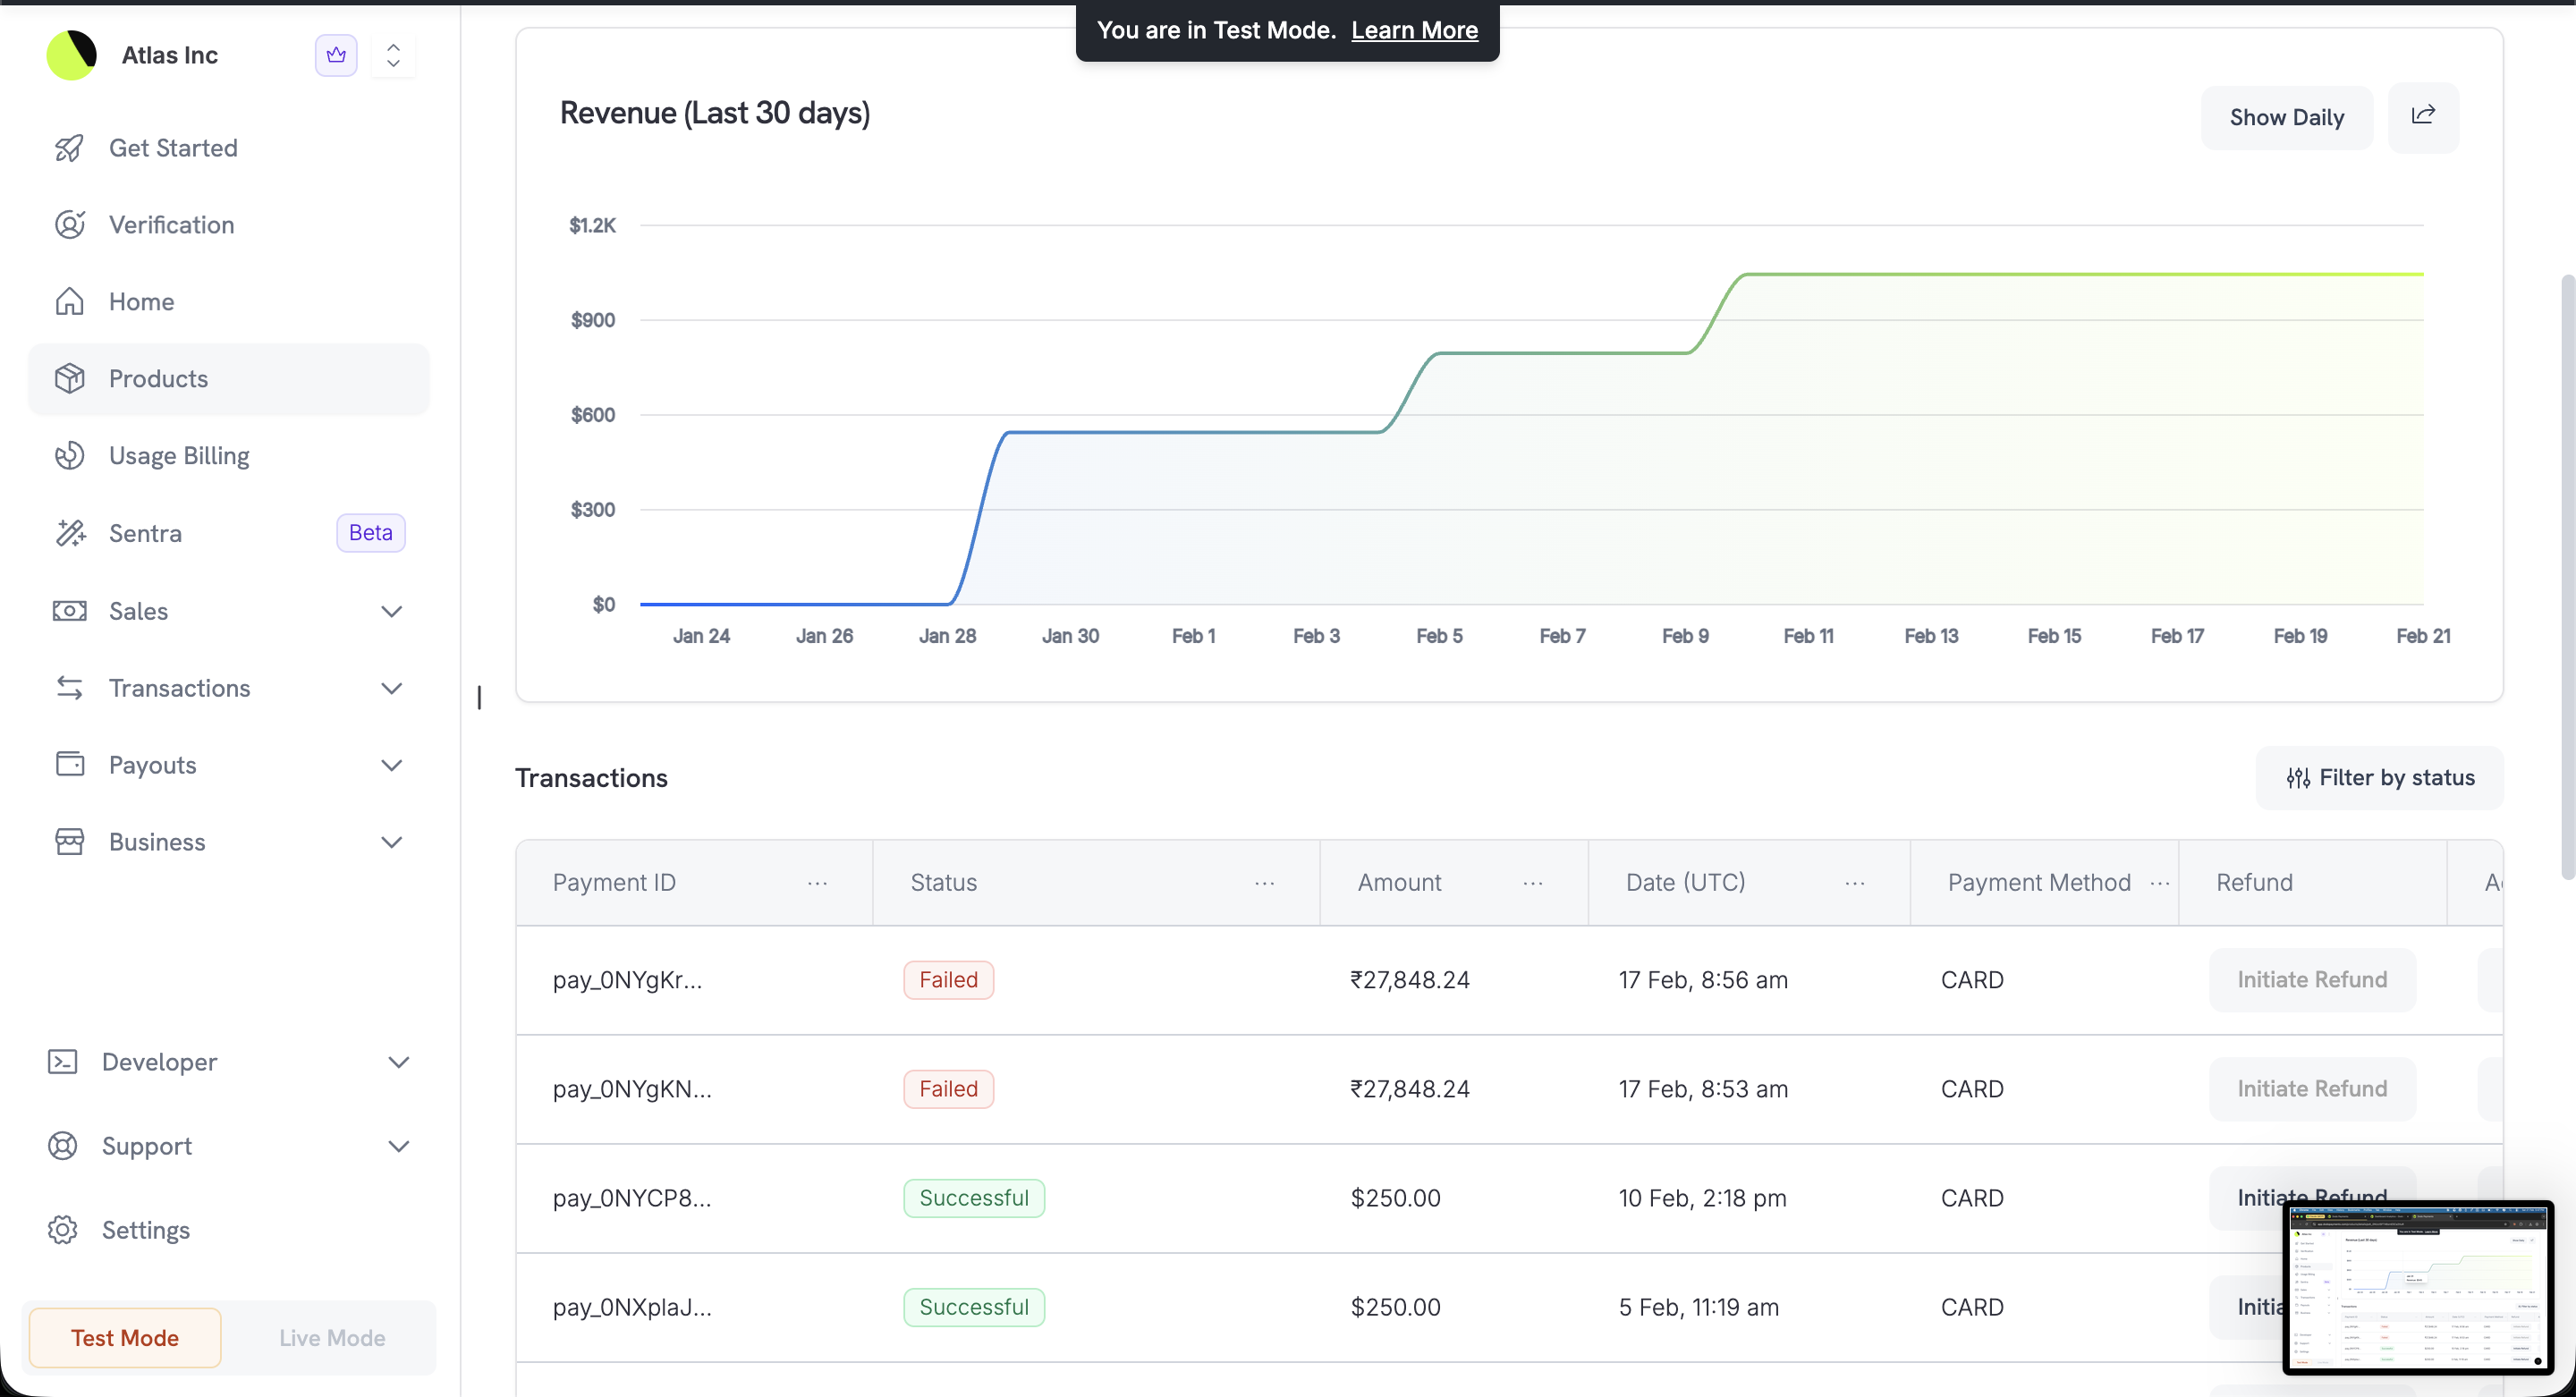
Transactions table showing payment history for the product
Customers Tab
この product を購入した customer と、その支出額を確認します。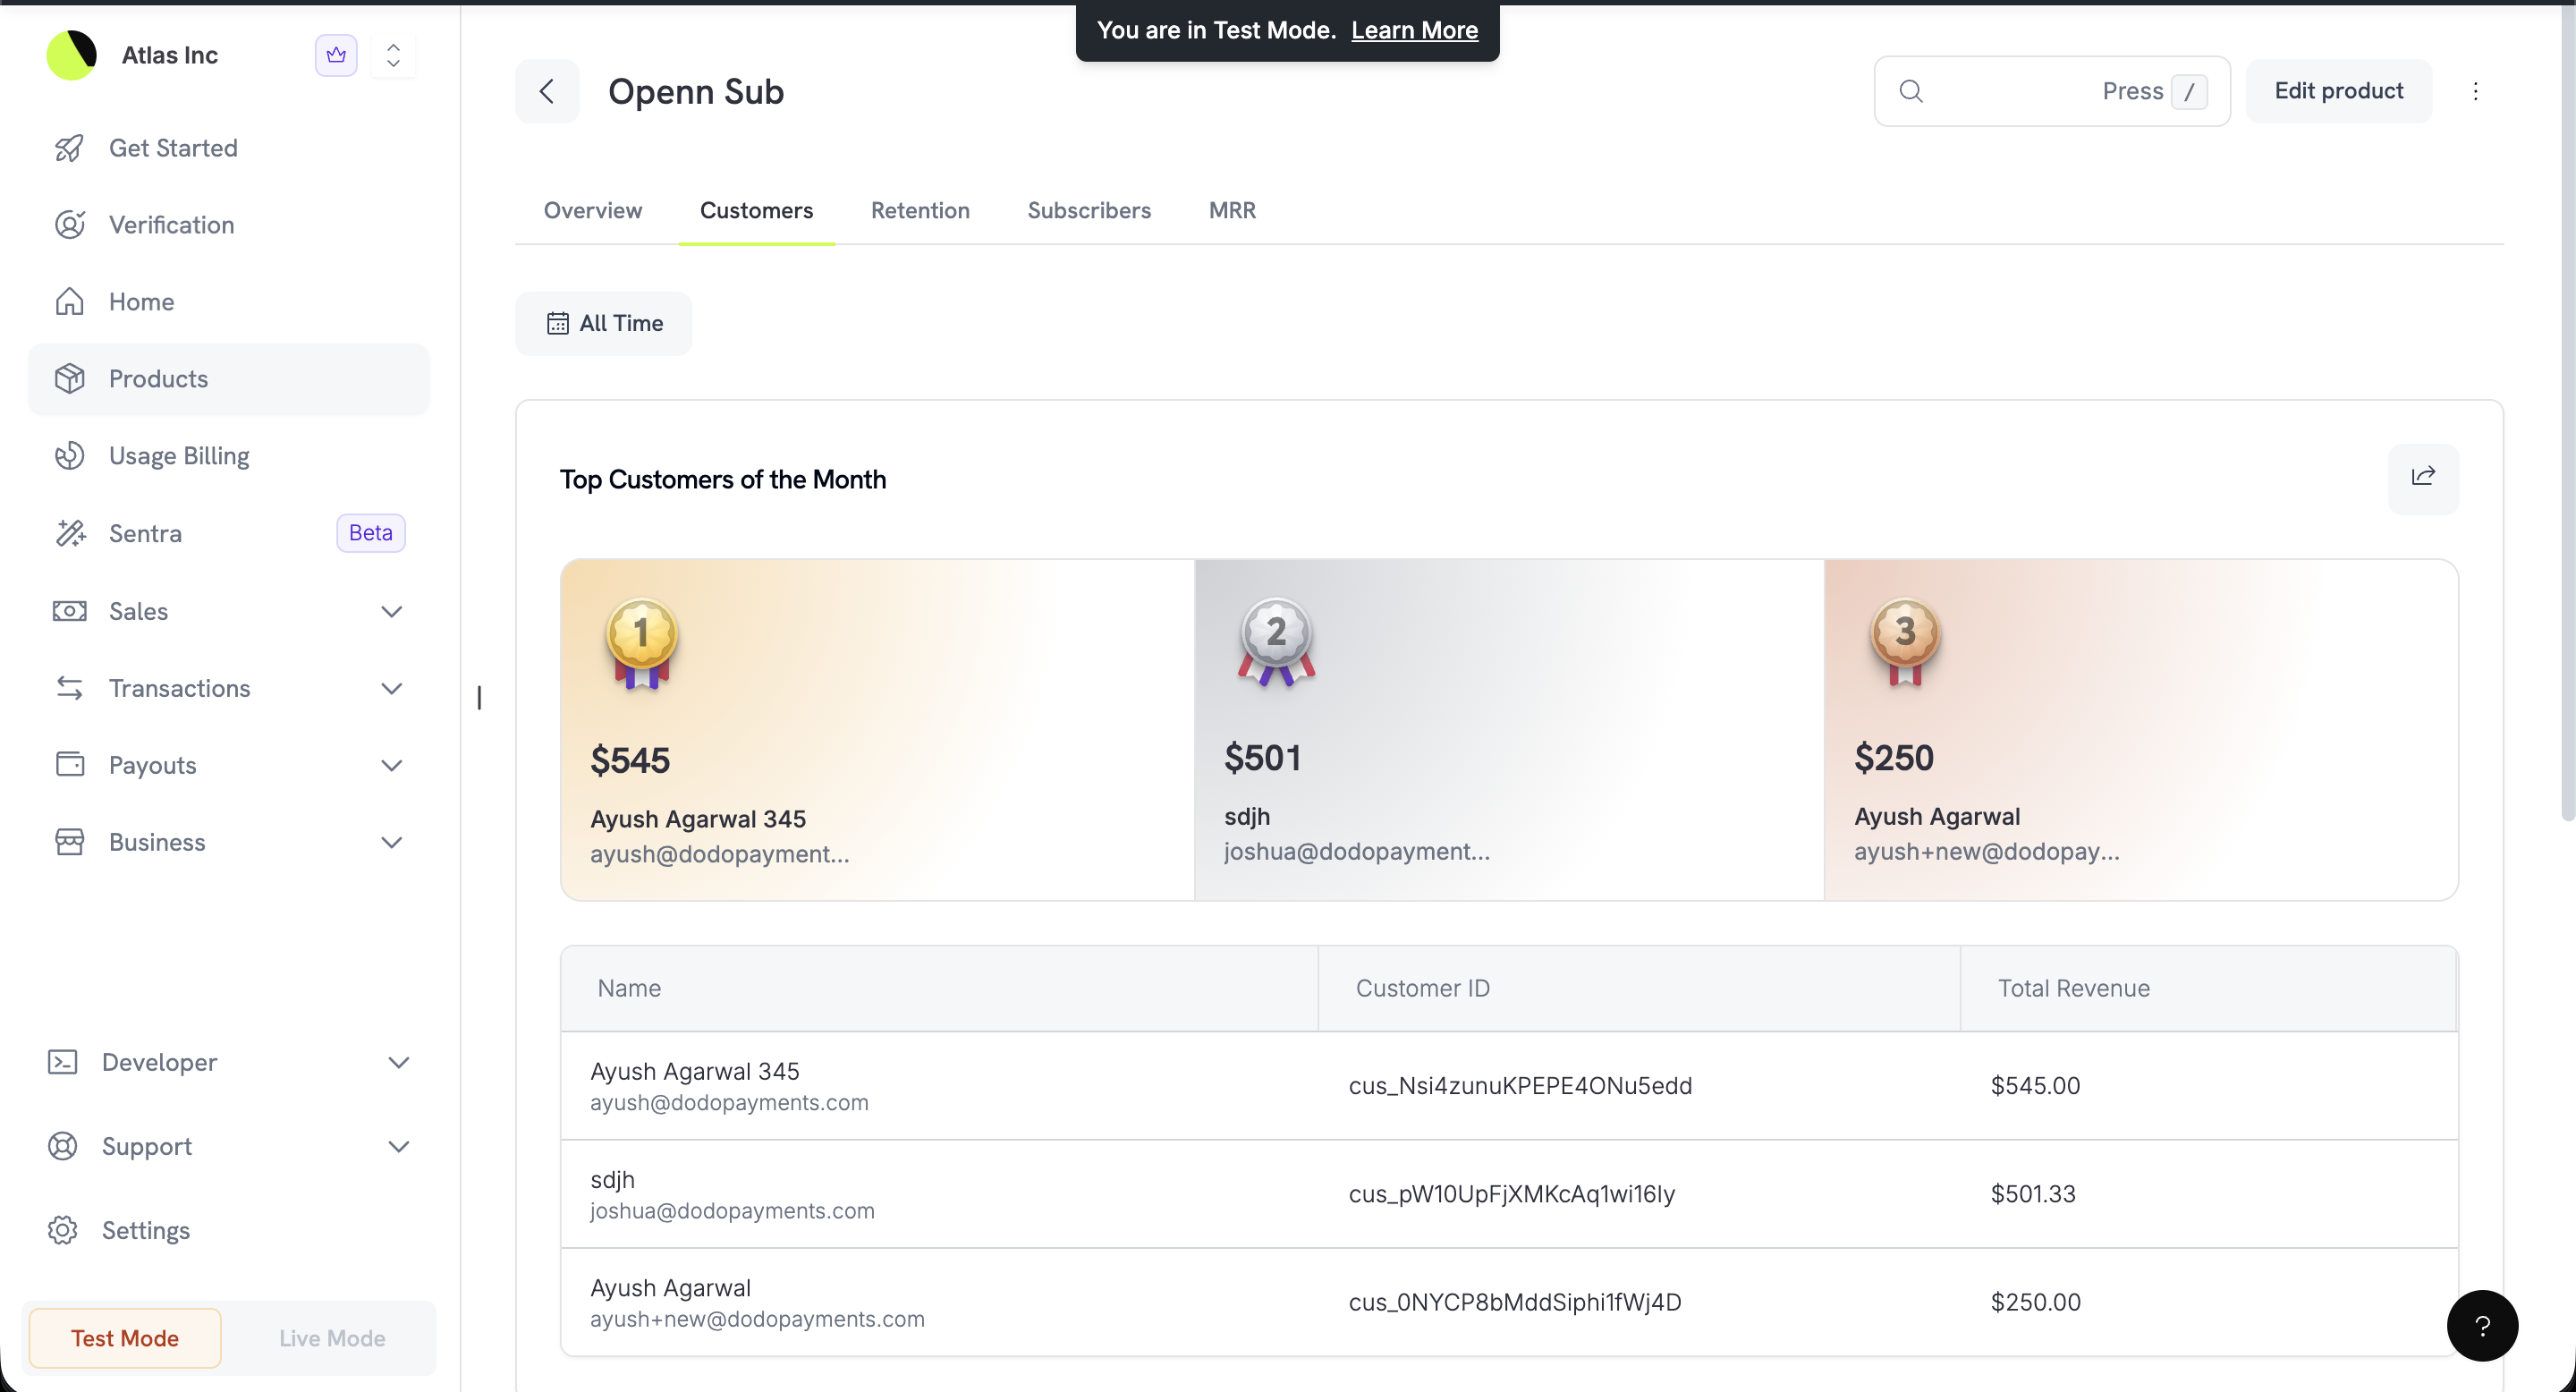
Top customers of the month with podium ranking and customer table
Retention Tab
この product が subscriber をどの程度維持できているかを確認します。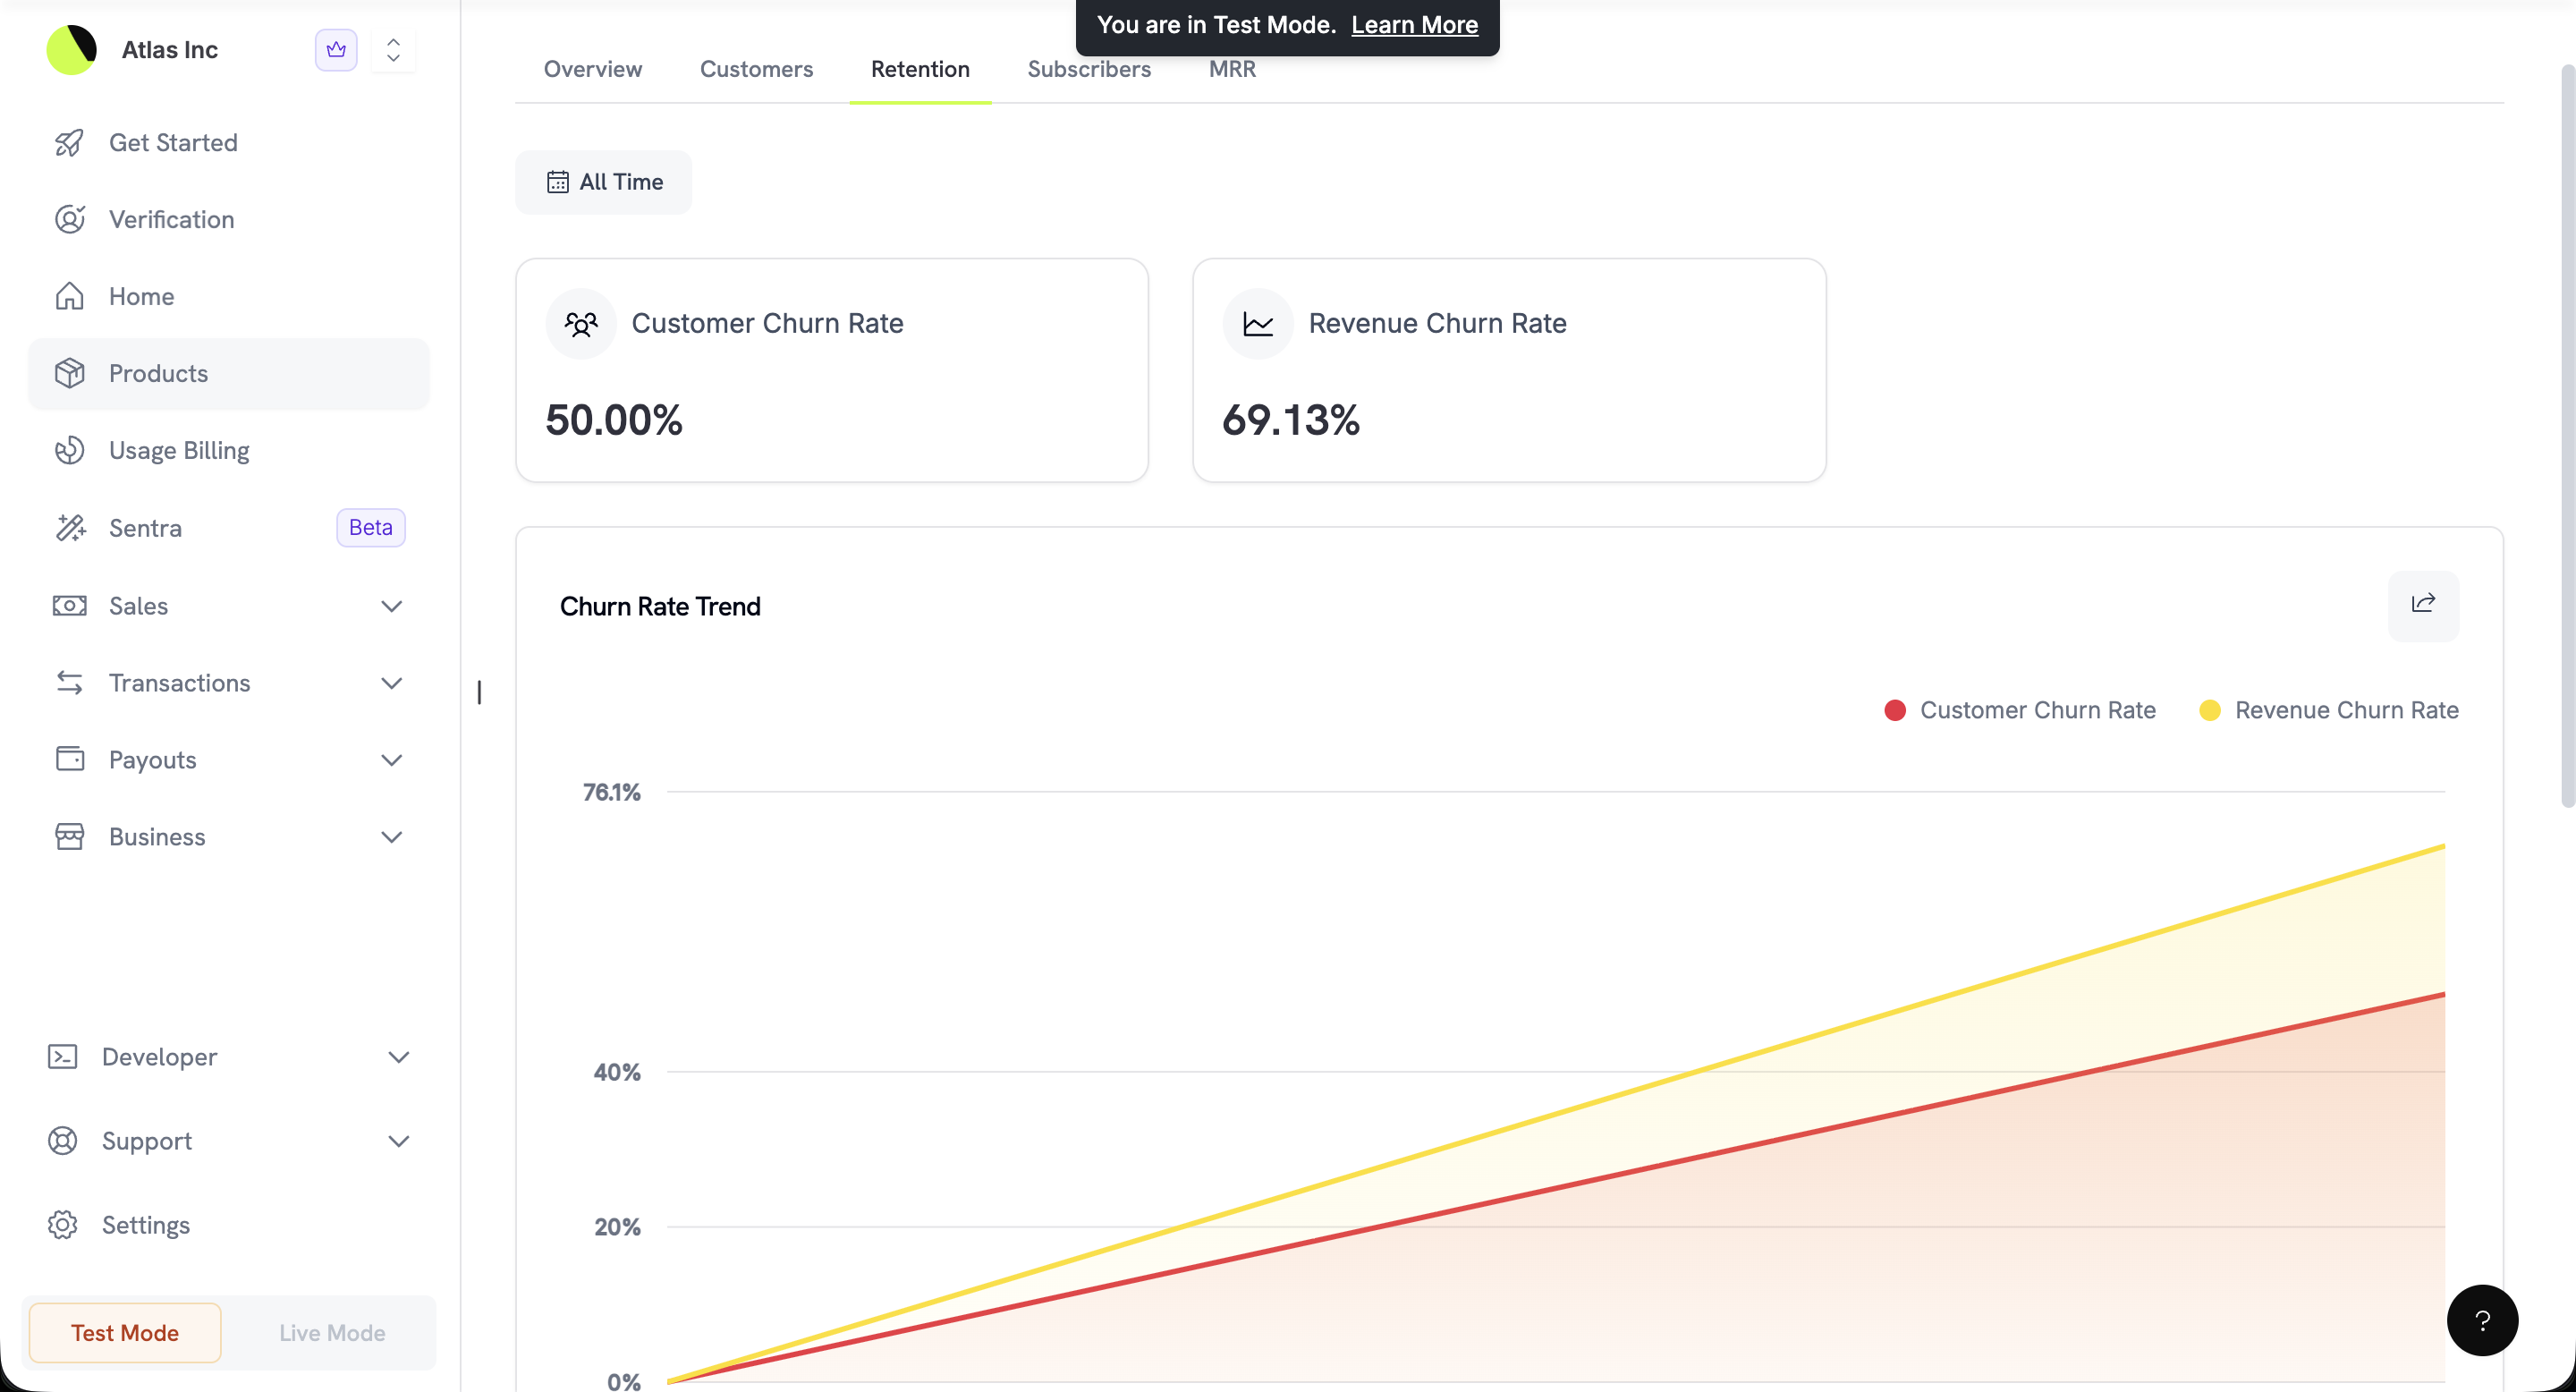
Customer and revenue churn rates with trend analysis
Subscribers Tab
選択した期間に作成された、この product の subscription の list。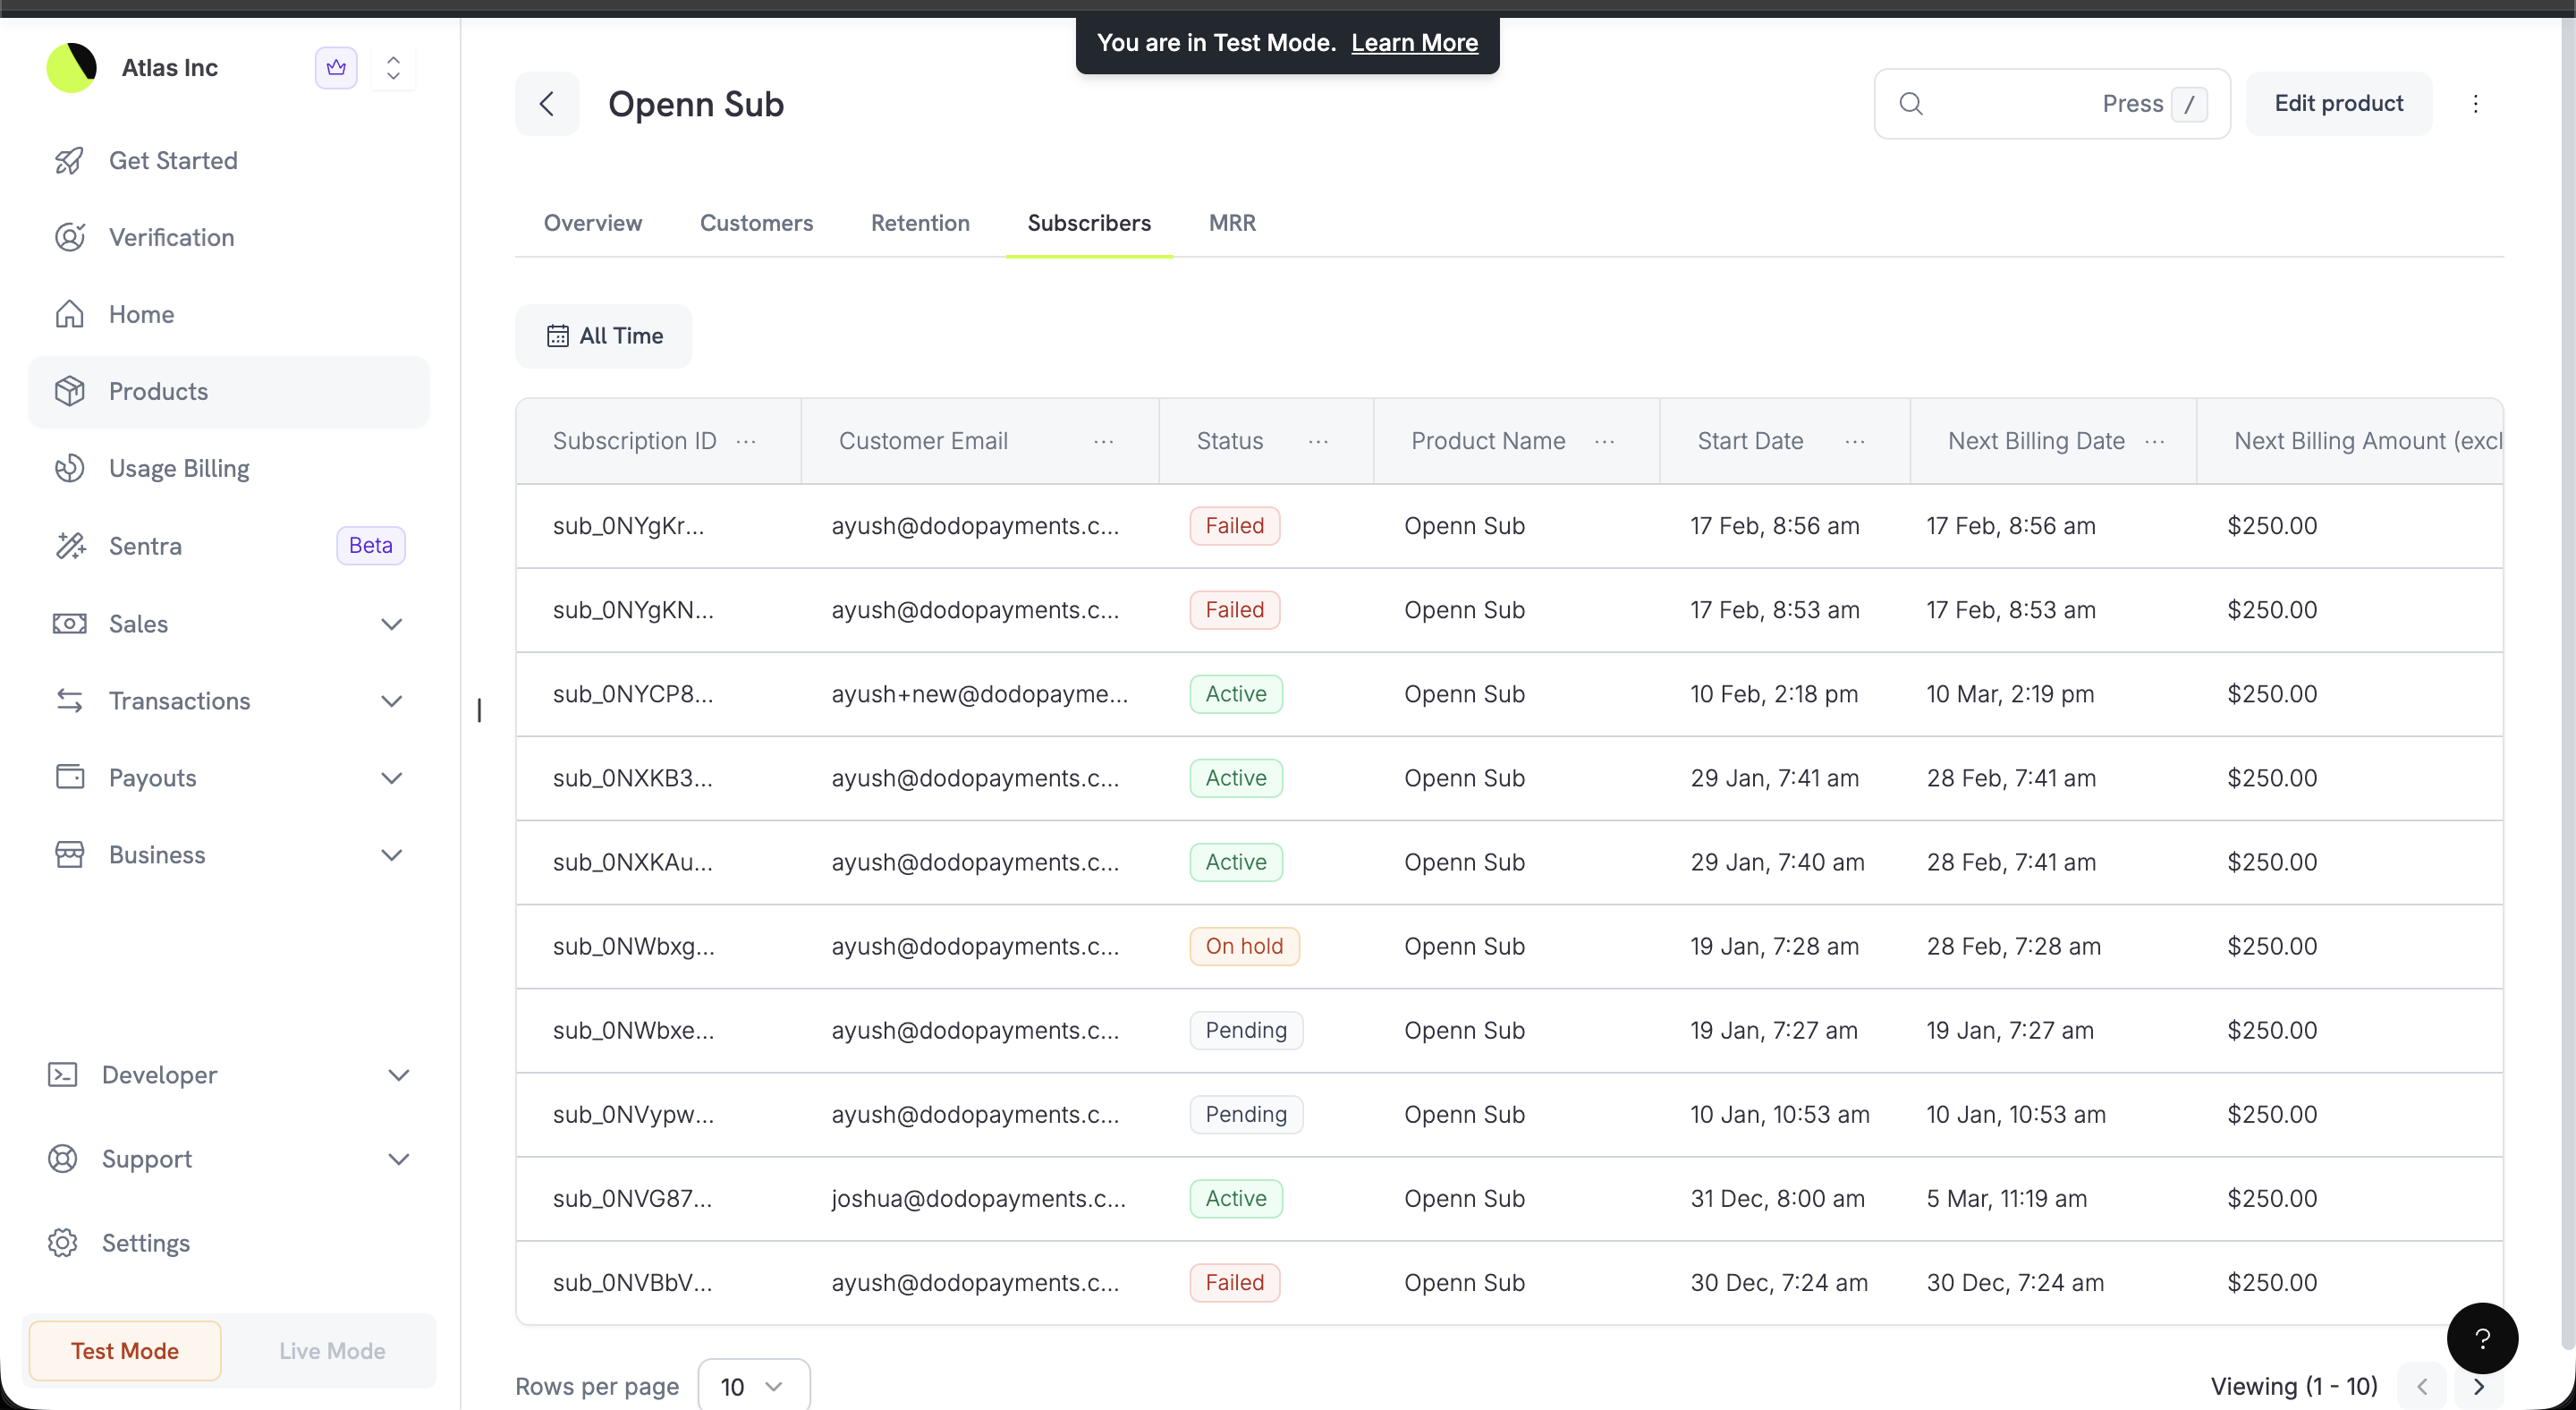
Subscribers table showing all subscriptions with statuses and billing details
MRR Tab
product の Monthly Recurring Revenue の内訳。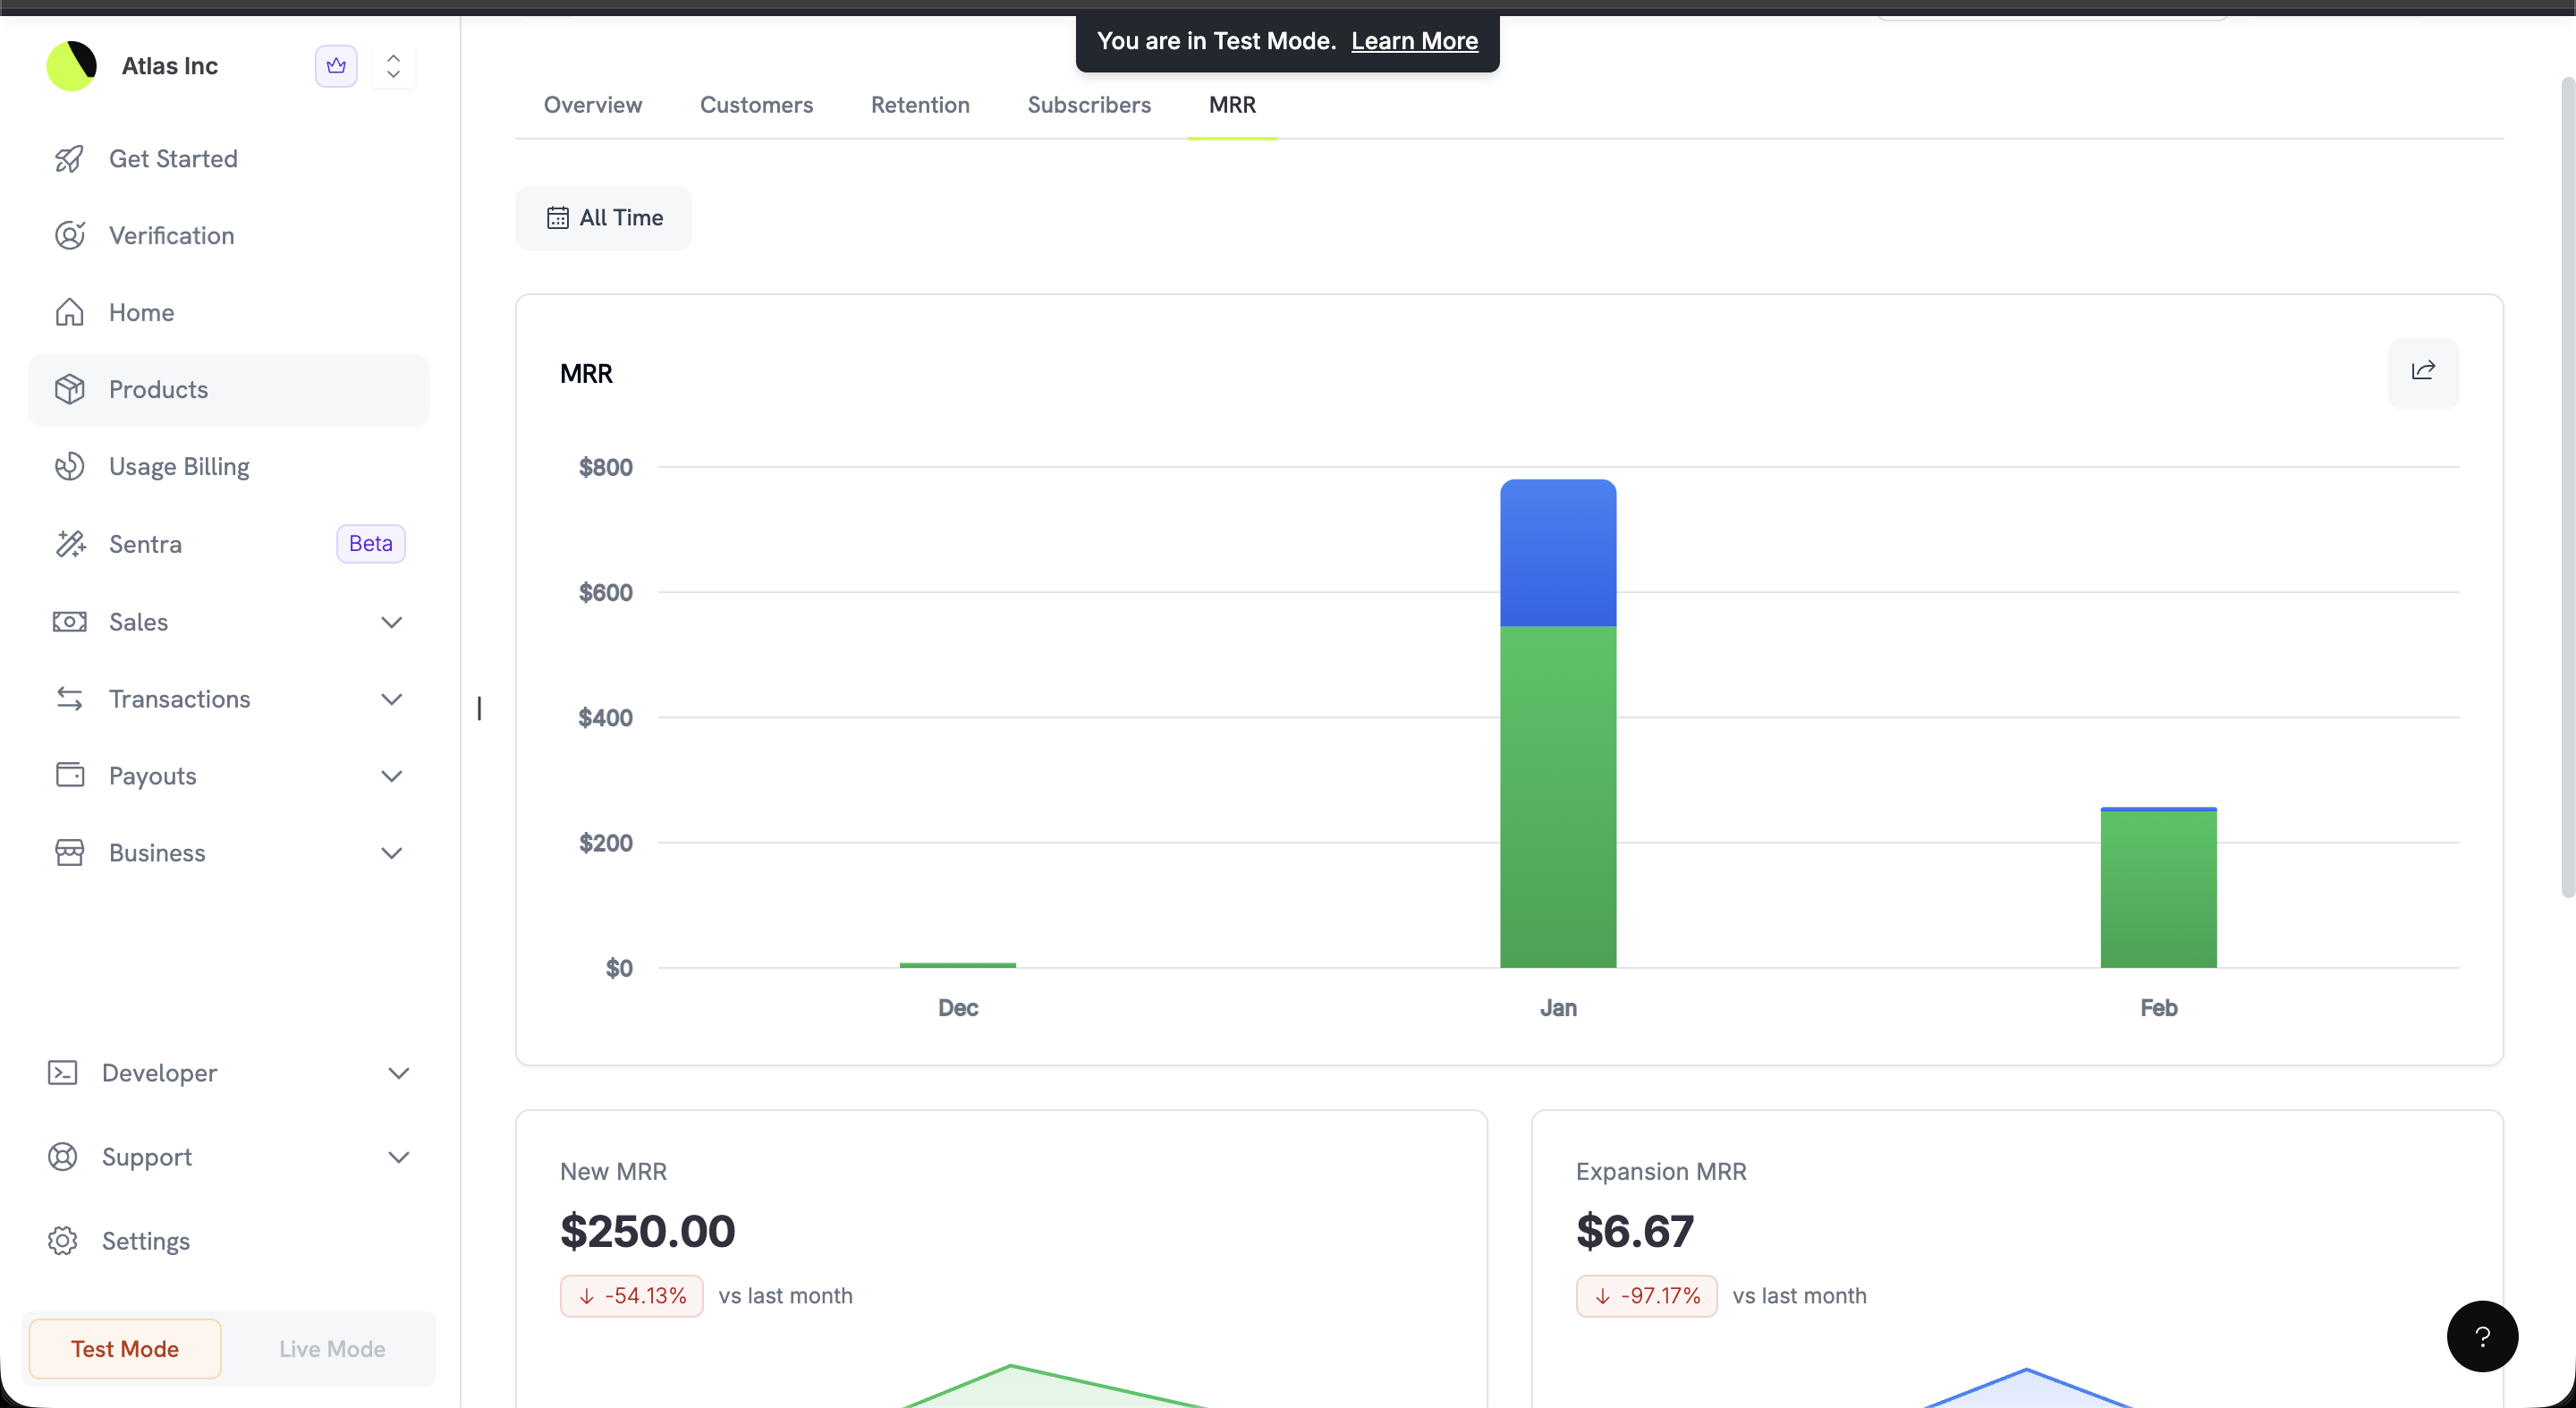
MRR stacked bar chart showing monthly revenue composition
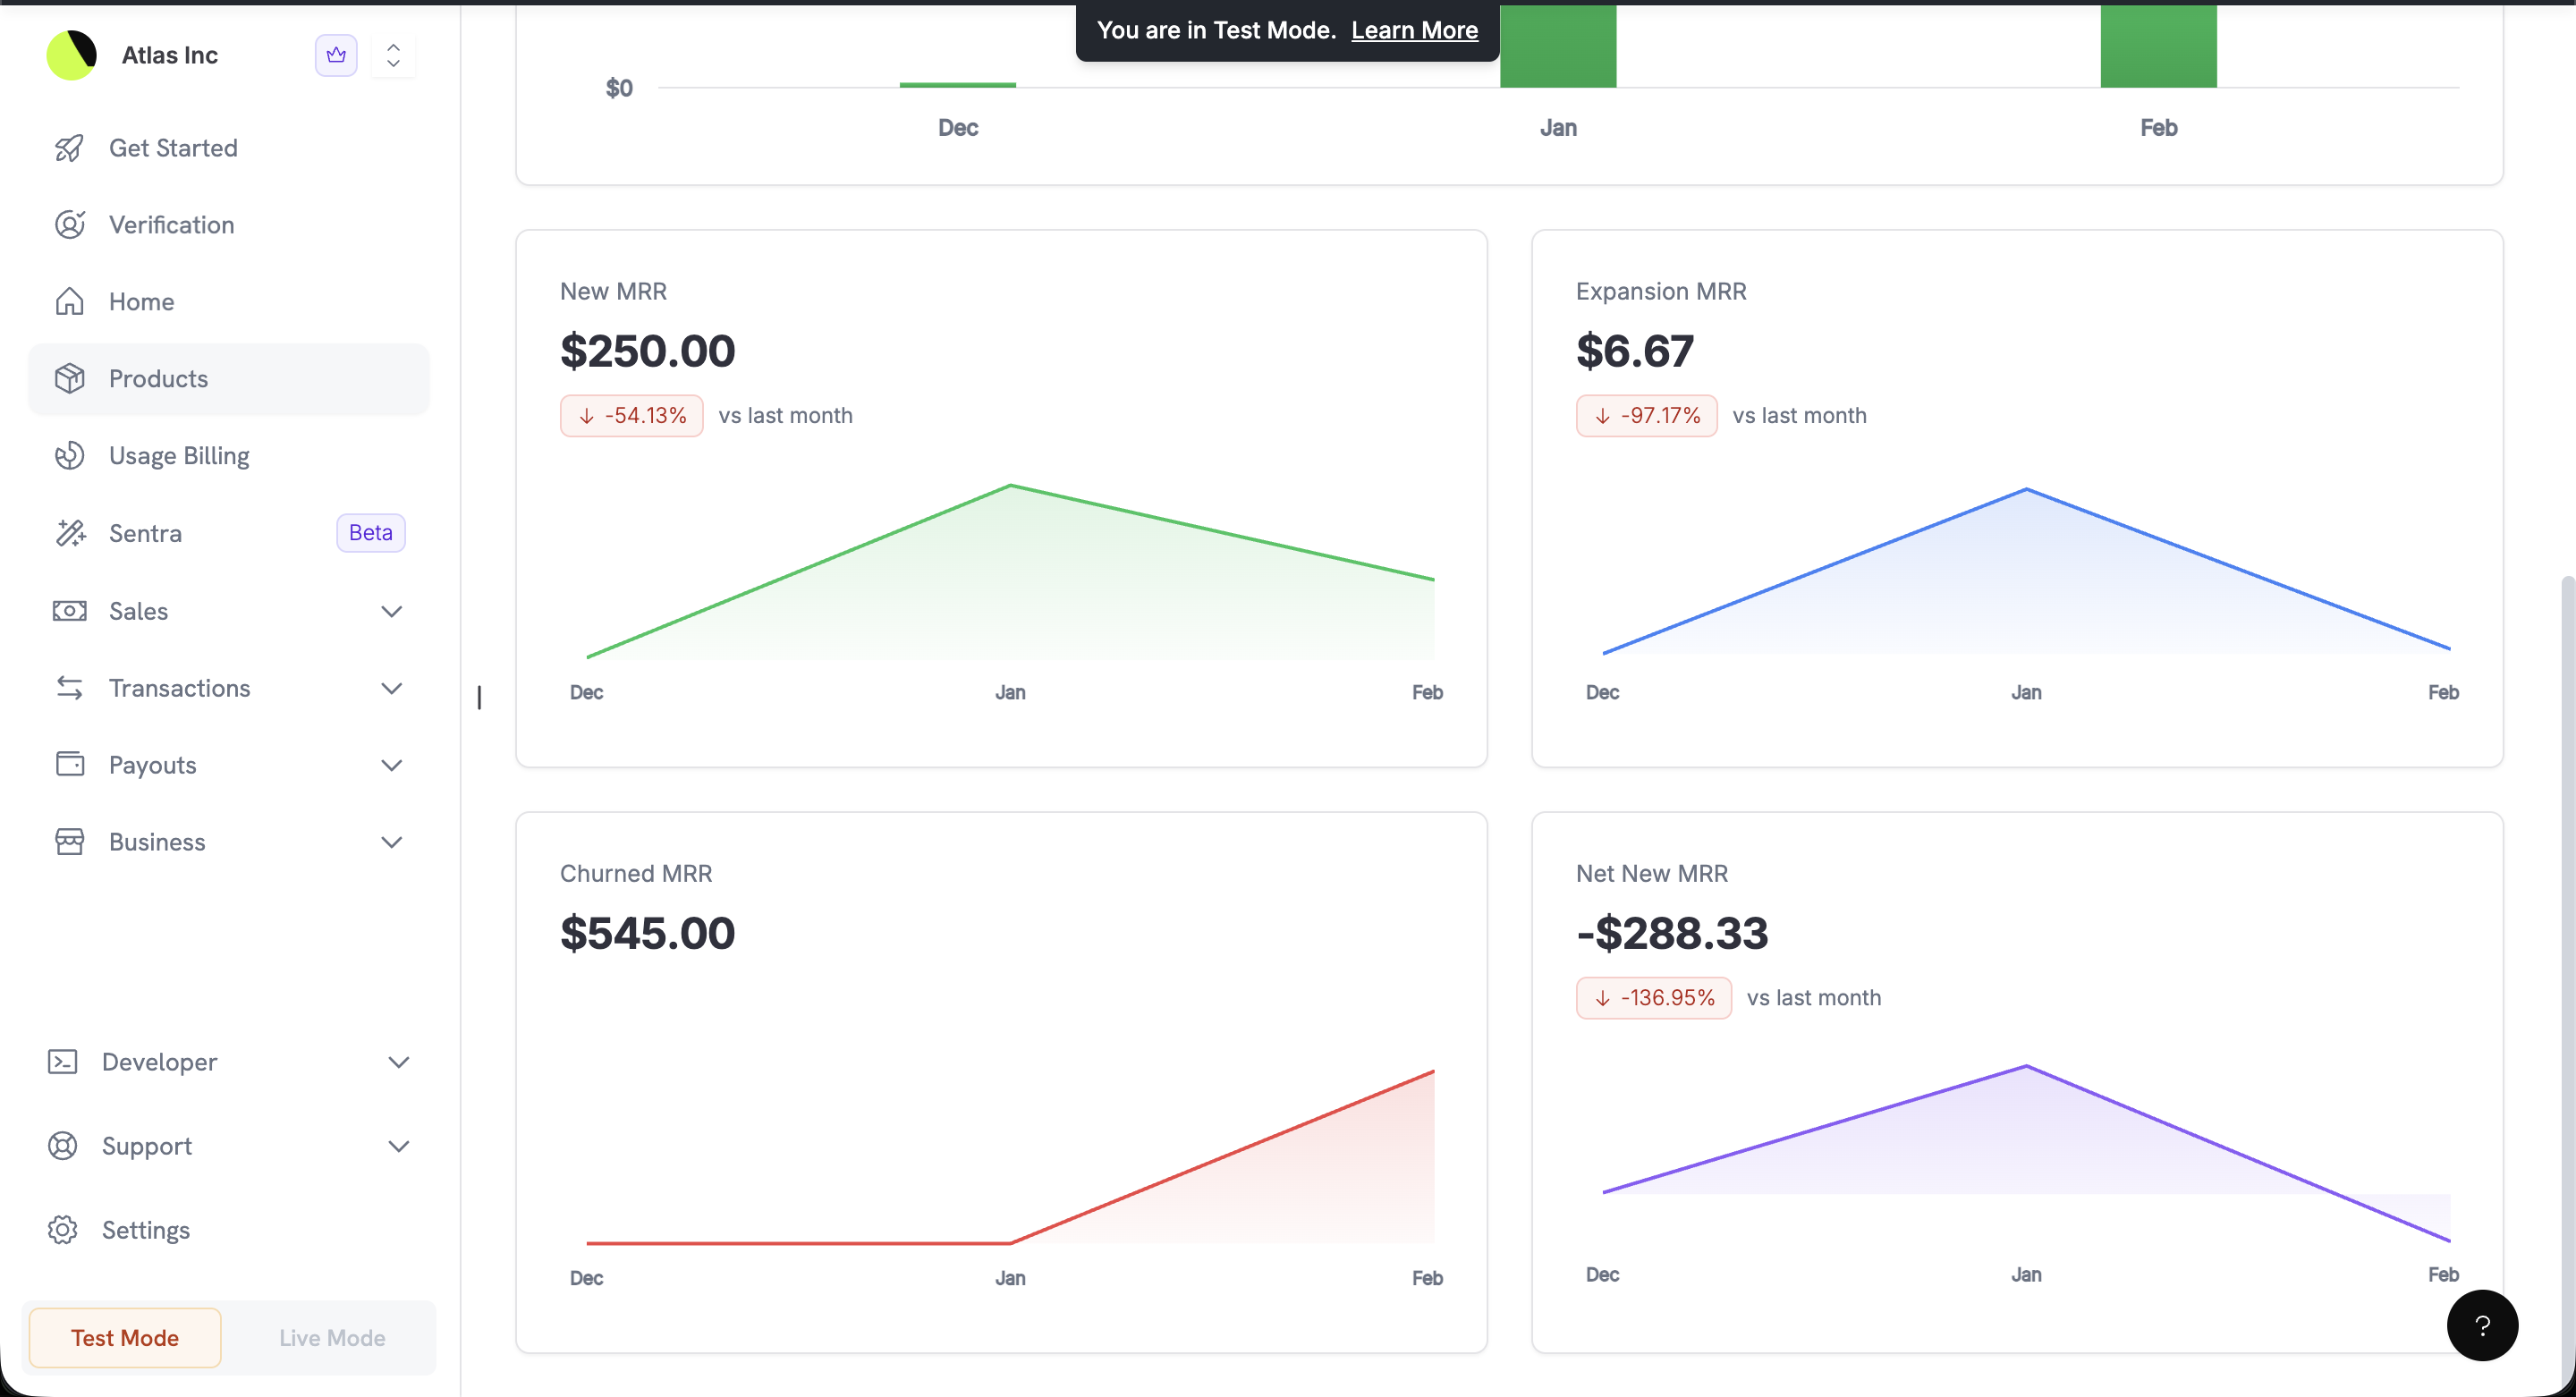
Detailed MRR breakdown with New, Expansion, Churned, and Net New MRR
Page Highlight Tiles
dashboard の多くの list page では、上部に highlight tiles が表示され、Analytics を開かずに summary metric を確認できます。tile は page の active filter に従います。Reports
Reports には専用 page があります:Settings → Reports。ここでは画面上で money movement を追跡し、任意の日付範囲の CSV または XLSX export を作成できます。Reports は live mode のみを対象とします。Reports
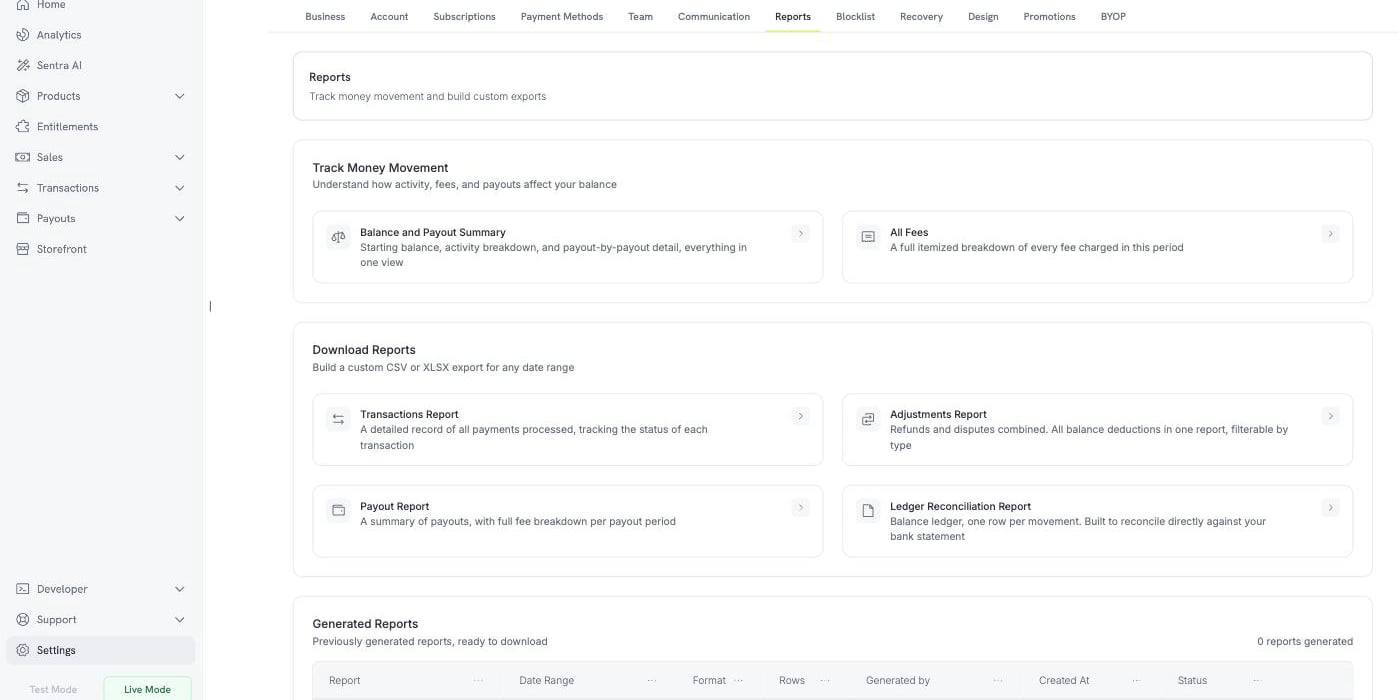
Settings → Reports: live views, custom exports, and your report history