Analytics and Reporting dashboard overview

소개

대시보드 분석을 통해 매출, 고객, 구독, 유지율, 결제 성공률 및 회수된 매출 등 비즈니스 성과를 확인할 수 있습니다. Home에서는 일일 현황을 빠르게 확인할 수 있습니다. Analytics에는 기간, 비교 대상 및 제품별 필터와 함께 전체 지표가 제공됩니다.

Home

오늘의 활동(Today)과 사용자가 맞춤 설정할 수 있는 개요입니다.

Business Analytics

비즈니스 전체의 매출, 고객, 구독, 유지율, 거래 상태 및 회수 현황입니다.

Product-Level Analytics

단일 제품에 대한 동일한 지표입니다. 매출, 고객, churn, 구독자 및 MRR을 확인할 수 있습니다.

Page Highlight Tiles

제품, 구독, 결제 및 기타 목록 페이지 상단에 표시되는 요약 지표입니다.

Reports

잔액을 조정하고 모든 수수료를 검토하며 원하는 기간을 CSV 또는 XLSX로 내보낼 수 있습니다.
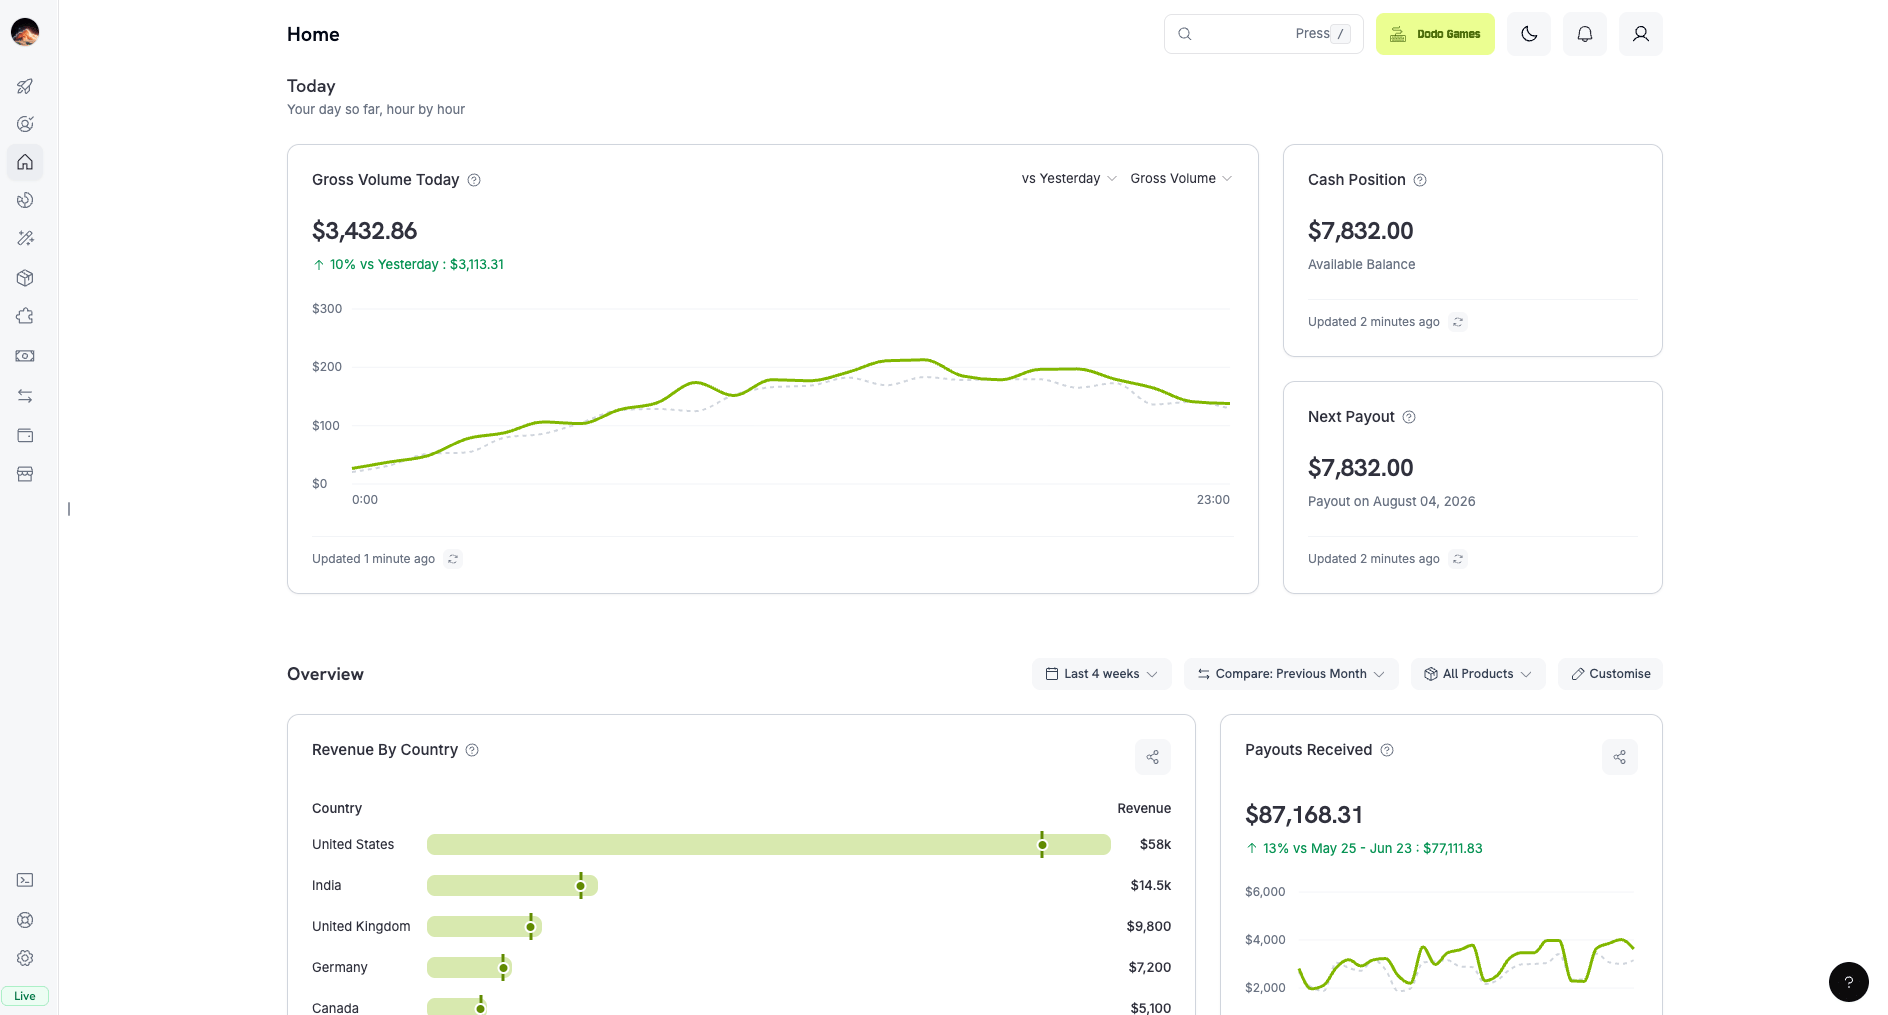
Dashboard Analytics Home page showing the Today pulse and a customizable overview of key business metrics

The Home dashboard: a daily pulse plus a customizable overview

Home

Home은 사이드바의 랜딩 페이지입니다. Today와 Overview의 두 섹션으로 구성됩니다.

Today

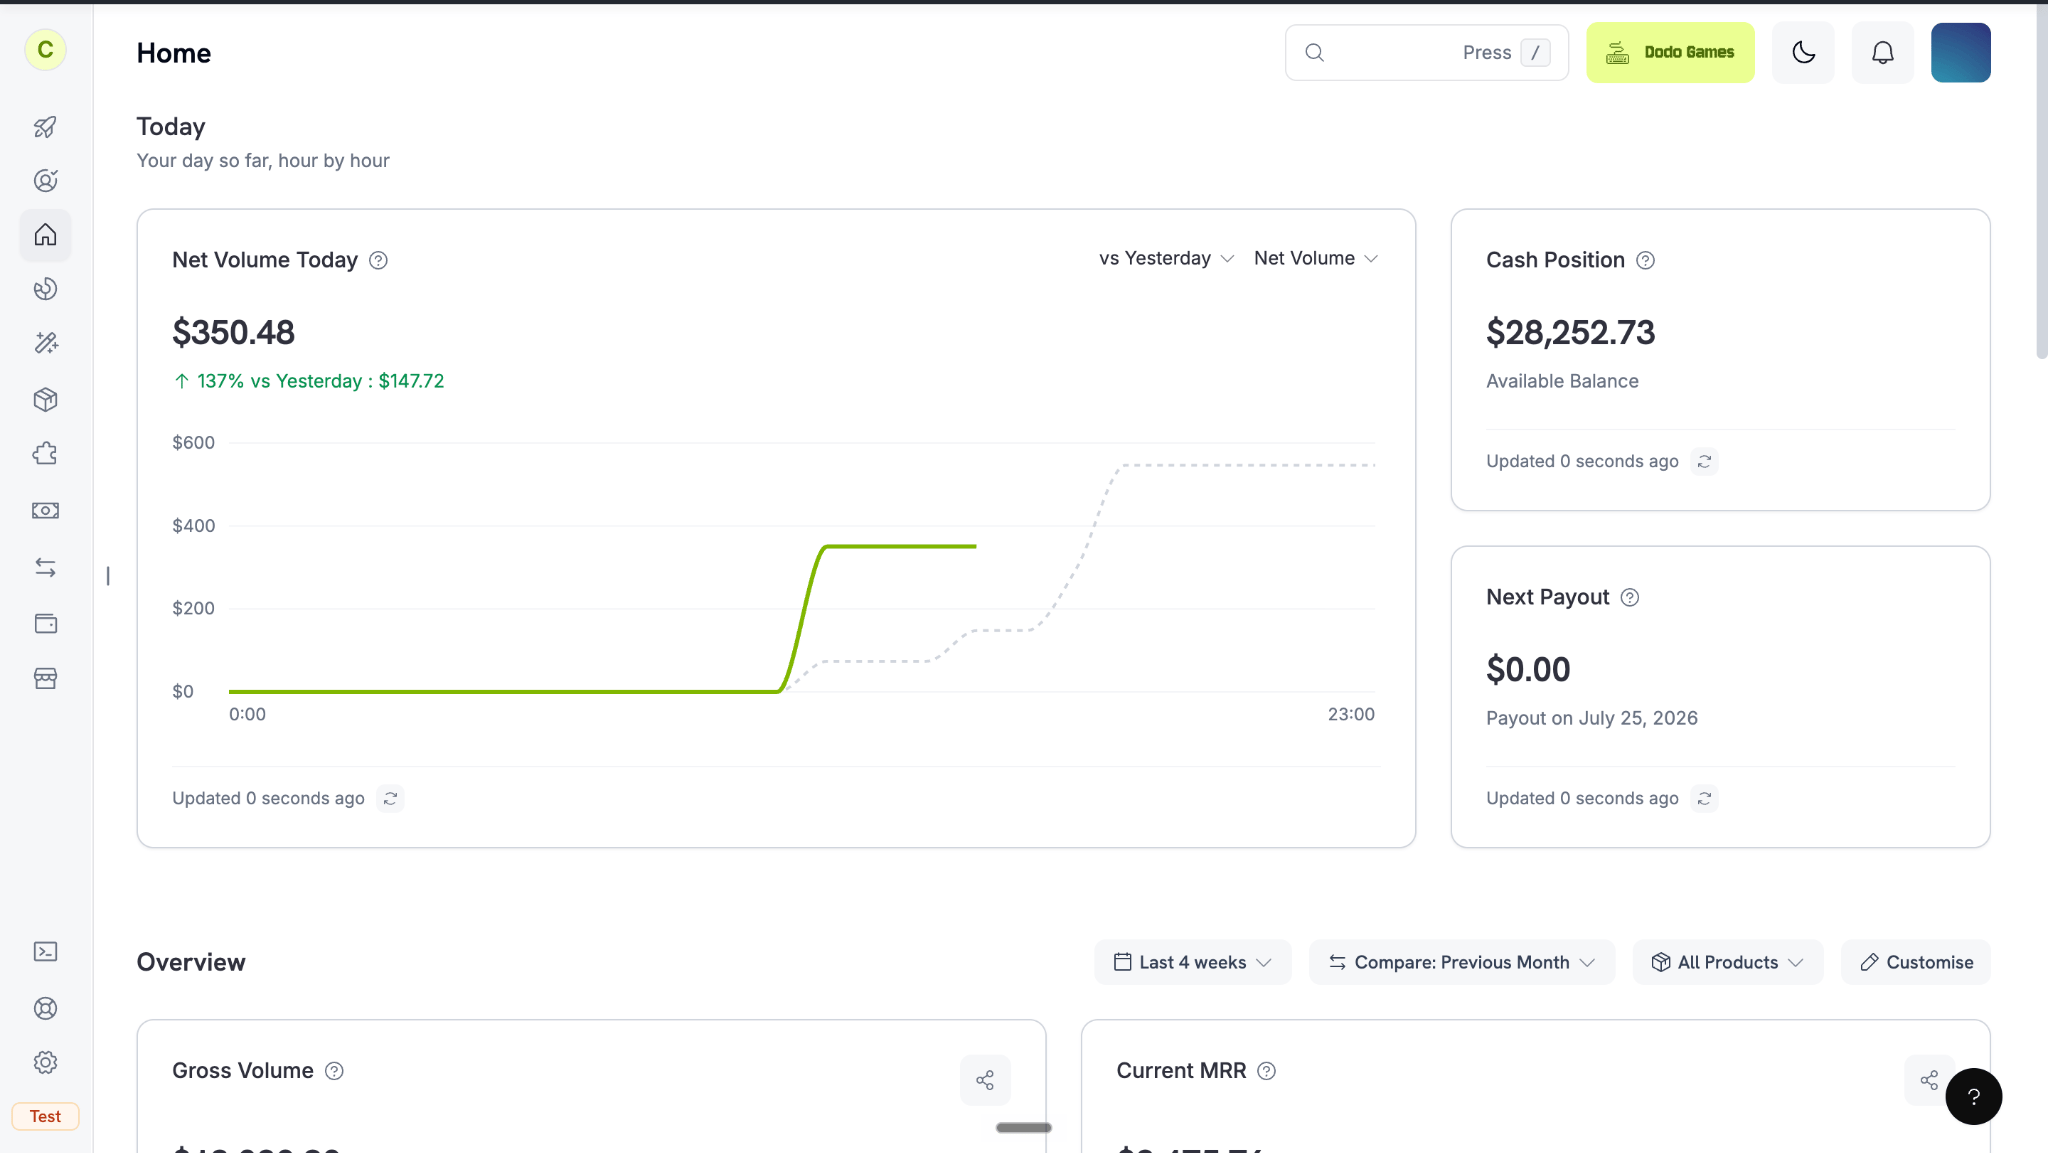
시간별 거래량 차트, 현금 잔액 및 다음 지급 타일이 표시된 Home Today 보기

Today: your day's pulse, hour by hour

Today에는 현재 날짜의 활동이 시간별로 표시됩니다.
  • Headline chart: Net Volume과 Gross Volume 사이를 전환합니다. 기본값은 Net Volume이며 각 시간을 전날의 동일한 시간과 비교해 표시합니다. 다른 날짜와 비교하려면 날짜를 선택하세요.
  • Cash Position: 잔액에서 사용할 수 있는 자금입니다. 현재 모드를 따르므로 test mode와 live mode에서는 서로 다른 잔액이 표시됩니다.
  • Next Payout: 다음 지급 금액과 날짜입니다. test mode에서도 항상 live mode 데이터를 표시합니다.
각 카드에는 정보 툴팁(ⓘ)과 “Updated” 타임스탬프가 있어 데이터가 얼마나 최신인지 확인할 수 있습니다.

Your Overview

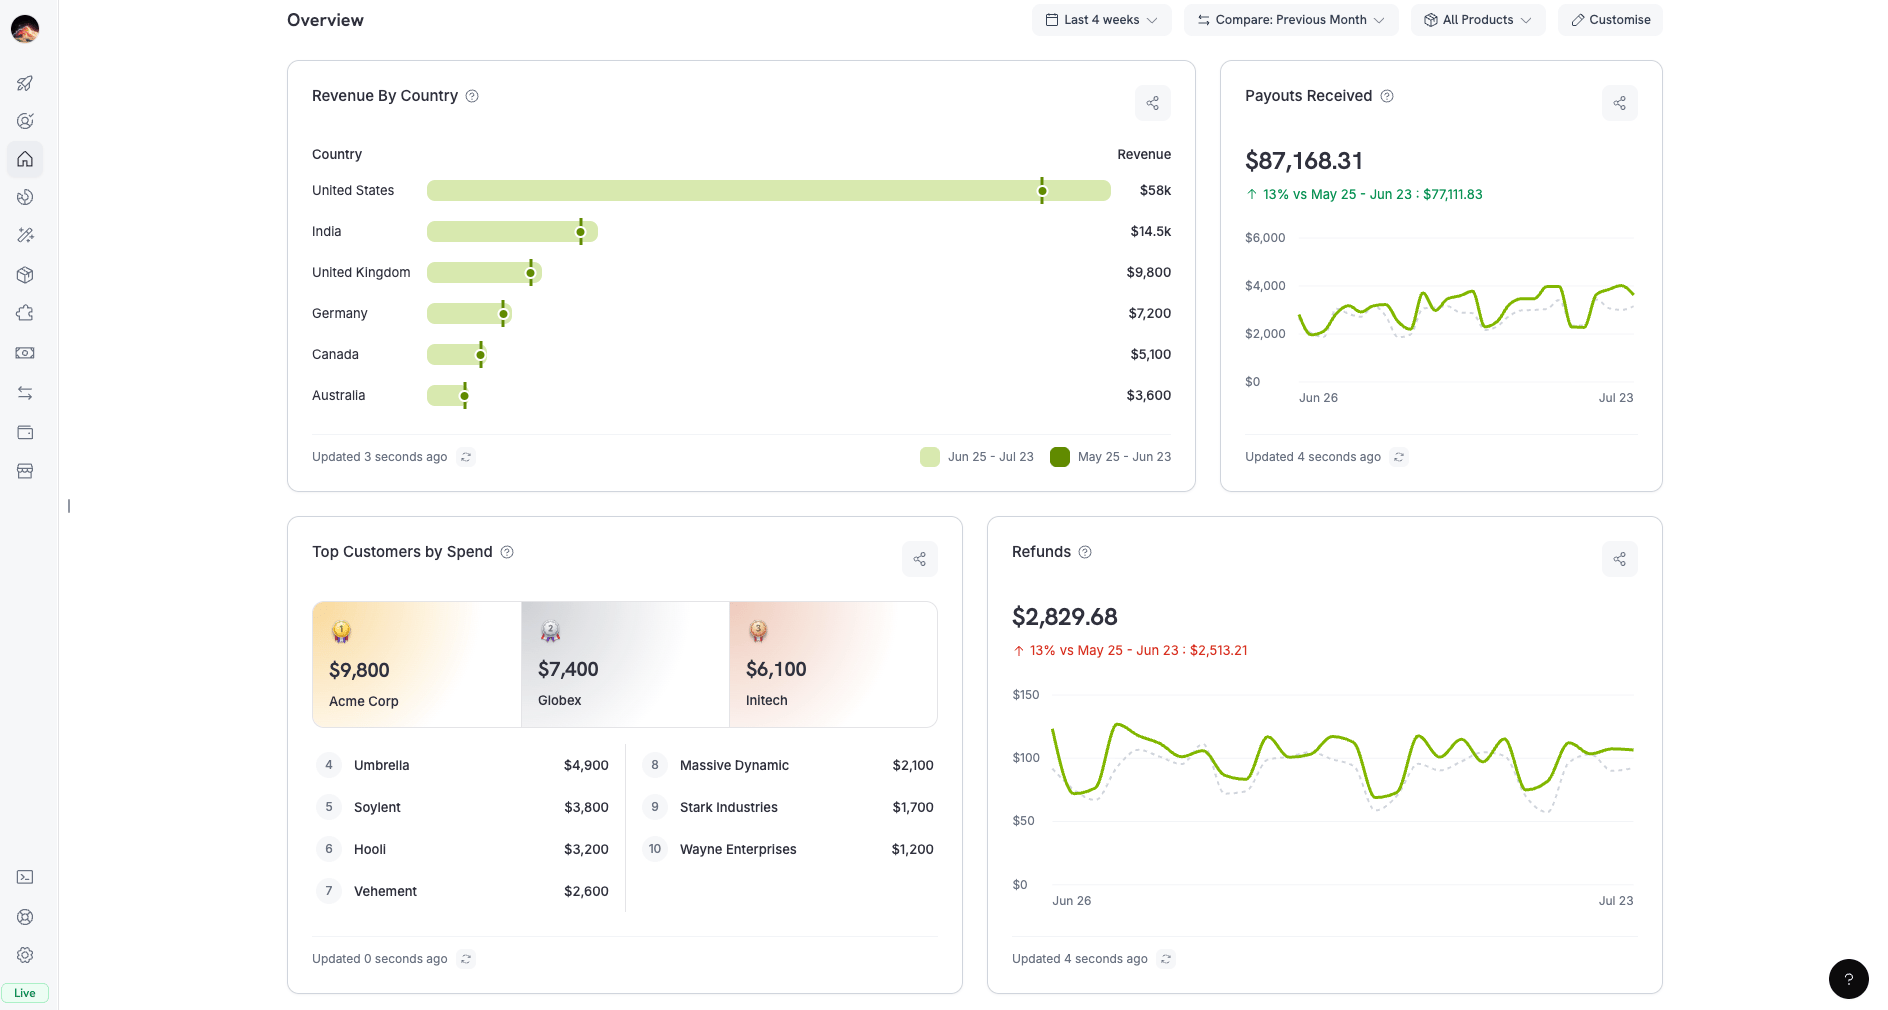
국가별 매출, 수령한 지급액, 지출 기준 주요 고객 및 환불을 맞춤 설정 가능한 카드로 표시하는 Home Your overview 보기

Your overview: a fully customizable set of metric cards

Overview는 사용자가 선택하는 지표 카드의 그리드입니다. 변경하려면 Customise를 클릭하세요. Customise Your Layout에서 카드를 드래그하여 순서를 변경하고, 카드를 삭제하며, 각 섹션에 표시할 지표를 선택할 수 있습니다. 레이아웃은 각 비즈니스별로 저장됩니다.
  • Default cards: Gross Volume, Net Volume, Refunds, New Customers, Top Customers by Spend, Average Order Value, Revenue By Country 및 Payment Success Rate.
  • Controls:
    • Period: Last 30 days와 같은 사전 설정 기간 또는 사용자 지정 날짜 범위입니다.
    • Compare: Previous Period(기본값), Previous Week, Previous Month 또는 Previous Year입니다.
    • Product: 하나 이상의 제품입니다. 기본값은 All Products입니다.

Analytics

사이드바에서 Home 바로 아래에 있는 Analytics를 열어 전체 비즈니스를 분석하세요. 6개의 탭이 있으며 각 탭에는 고유한 필터가 있습니다.

Revenue

Gross 및 net volume, 지급액, 환불, dispute 및 주요 시장입니다.

Customers

활성 고객과 신규 고객, ARPU, 주요 고객 및 모델링된 LTV입니다.

Subscriptions

MRR, Projected ARR, 활성 구독 및 전체 MRR 분석입니다.

Retention

고객 및 매출 churn, NRR 및 GRR, cohort 및 trial conversion입니다.

Success Rate

실패 원인 분석과 함께 결제 및 환불 성공률을 제공합니다.

Recovery

결제 재시도, dunning 및 abandoned cart recovery 성과입니다.

Filtering & Customization

각 탭에는 세 가지 컨트롤이 있는 필터 바가 있습니다:
  • Time Period: 사전 설정된 기간 범위(Today, Last 7 days, Last 30 days, Month to date, Quarter to date, Last 6 months 또는 All time) 또는 사용자 지정 날짜 범위입니다. 새 대시보드는 Last 30 days로 시작합니다.
  • Compare: Previous Period(기본값), Previous Week, Previous Month 또는 Previous Year입니다. 비교할 이전 기간이 없으므로 All time에서는 비교할 수 없습니다.
  • Product: 다중 선택이며 기본값은 All Products입니다. Revenue, Customers, Subscriptions 및 Retention 탭에 필터가 적용됩니다. Payouts Received, Refunds, Disputes, 그리고 대부분의 Success Rate 및 Recovery 카드는 항상 모든 제품을 대상으로 합니다.
Dodo Payments는 각 비즈니스의 날짜 범위와 비교 선택을 기억하고 이를 프로필과 동기화합니다. 비즈니스를 전환하거나 나중에 다시 방문하거나 다른 기기에서 로그인해도 각 비즈니스에는 마지막으로 사용한 기간이 유지됩니다. Product 필터는 저장되지 않으며 각 세션에서 초기화됩니다.
필터를 사용하여 특정 제품 또는 기간에 집중하세요.

Revenue Tab

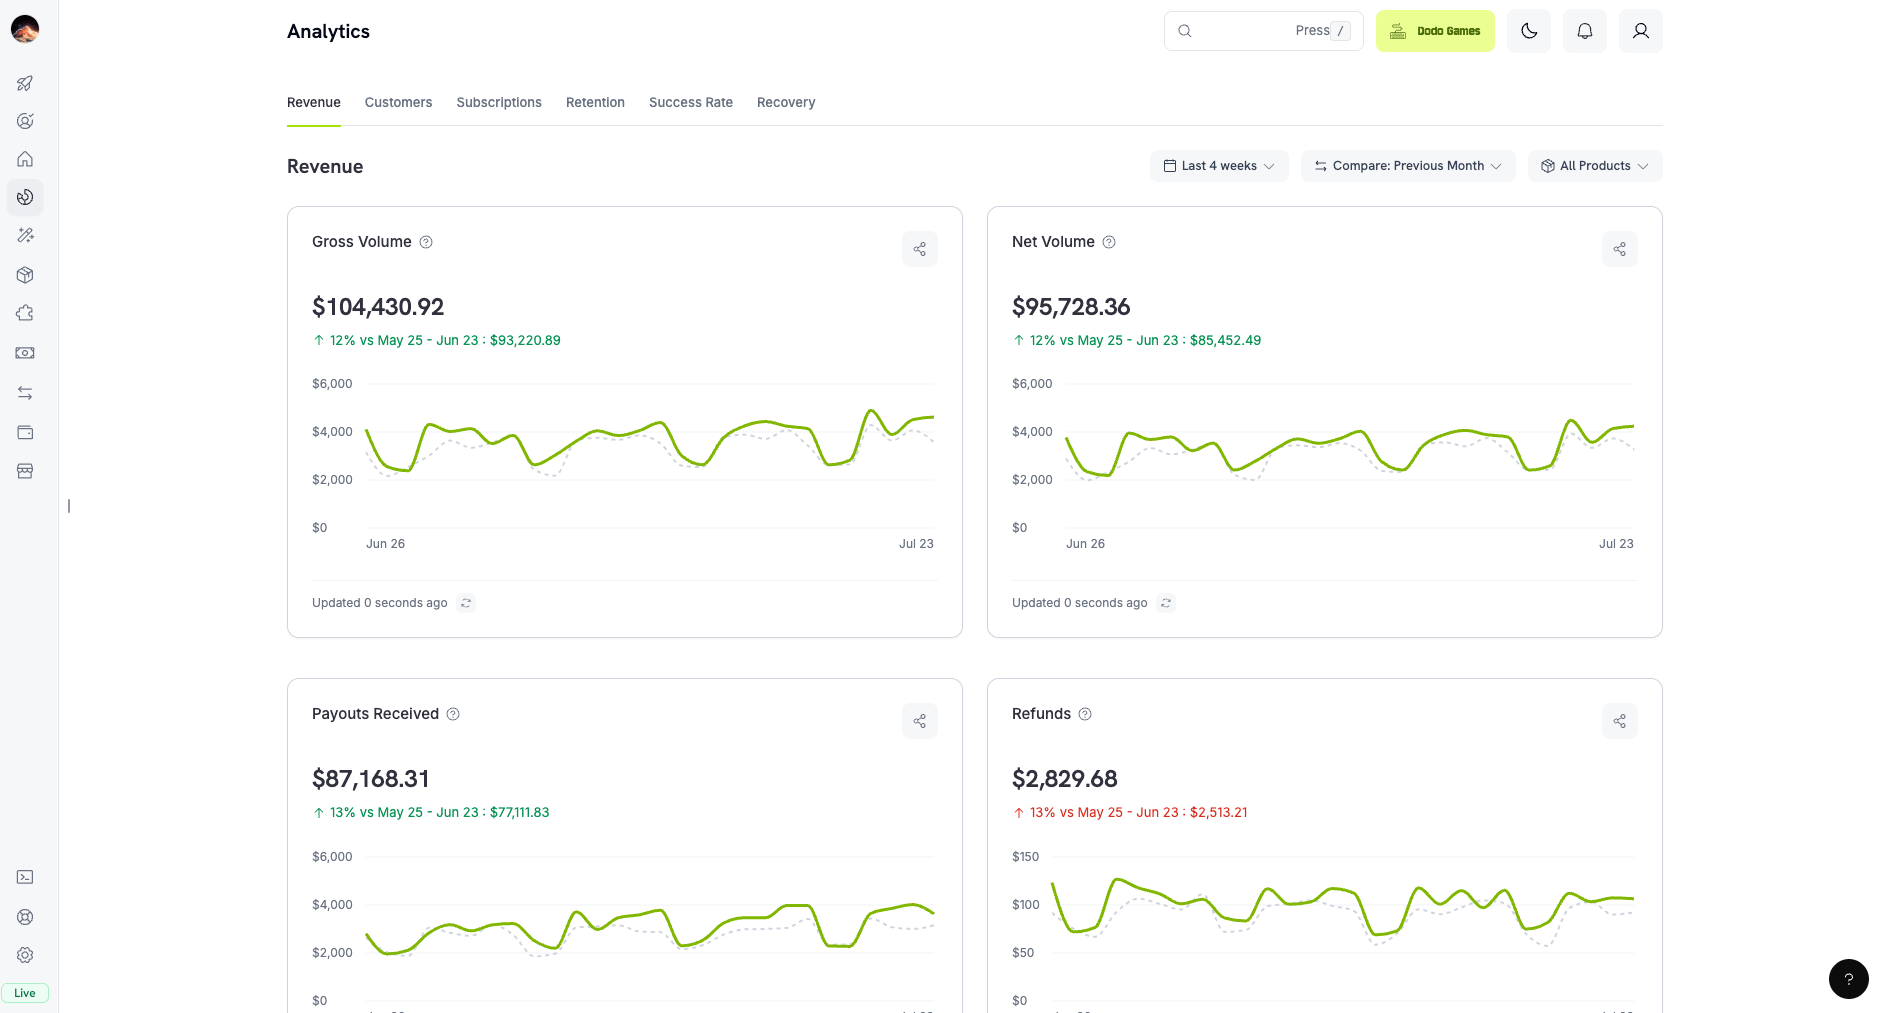
Gross volume, net volume, 수령한 지급액 및 환불 카드와 추세 차트를 표시하는 Revenue 탭

Revenue tab: gross/net volume, payouts, and refunds

수입, 지급금 및 dispute 활동을 추적하여 revenue 추세와 주요 시장을 확인합니다.

Customers Tab

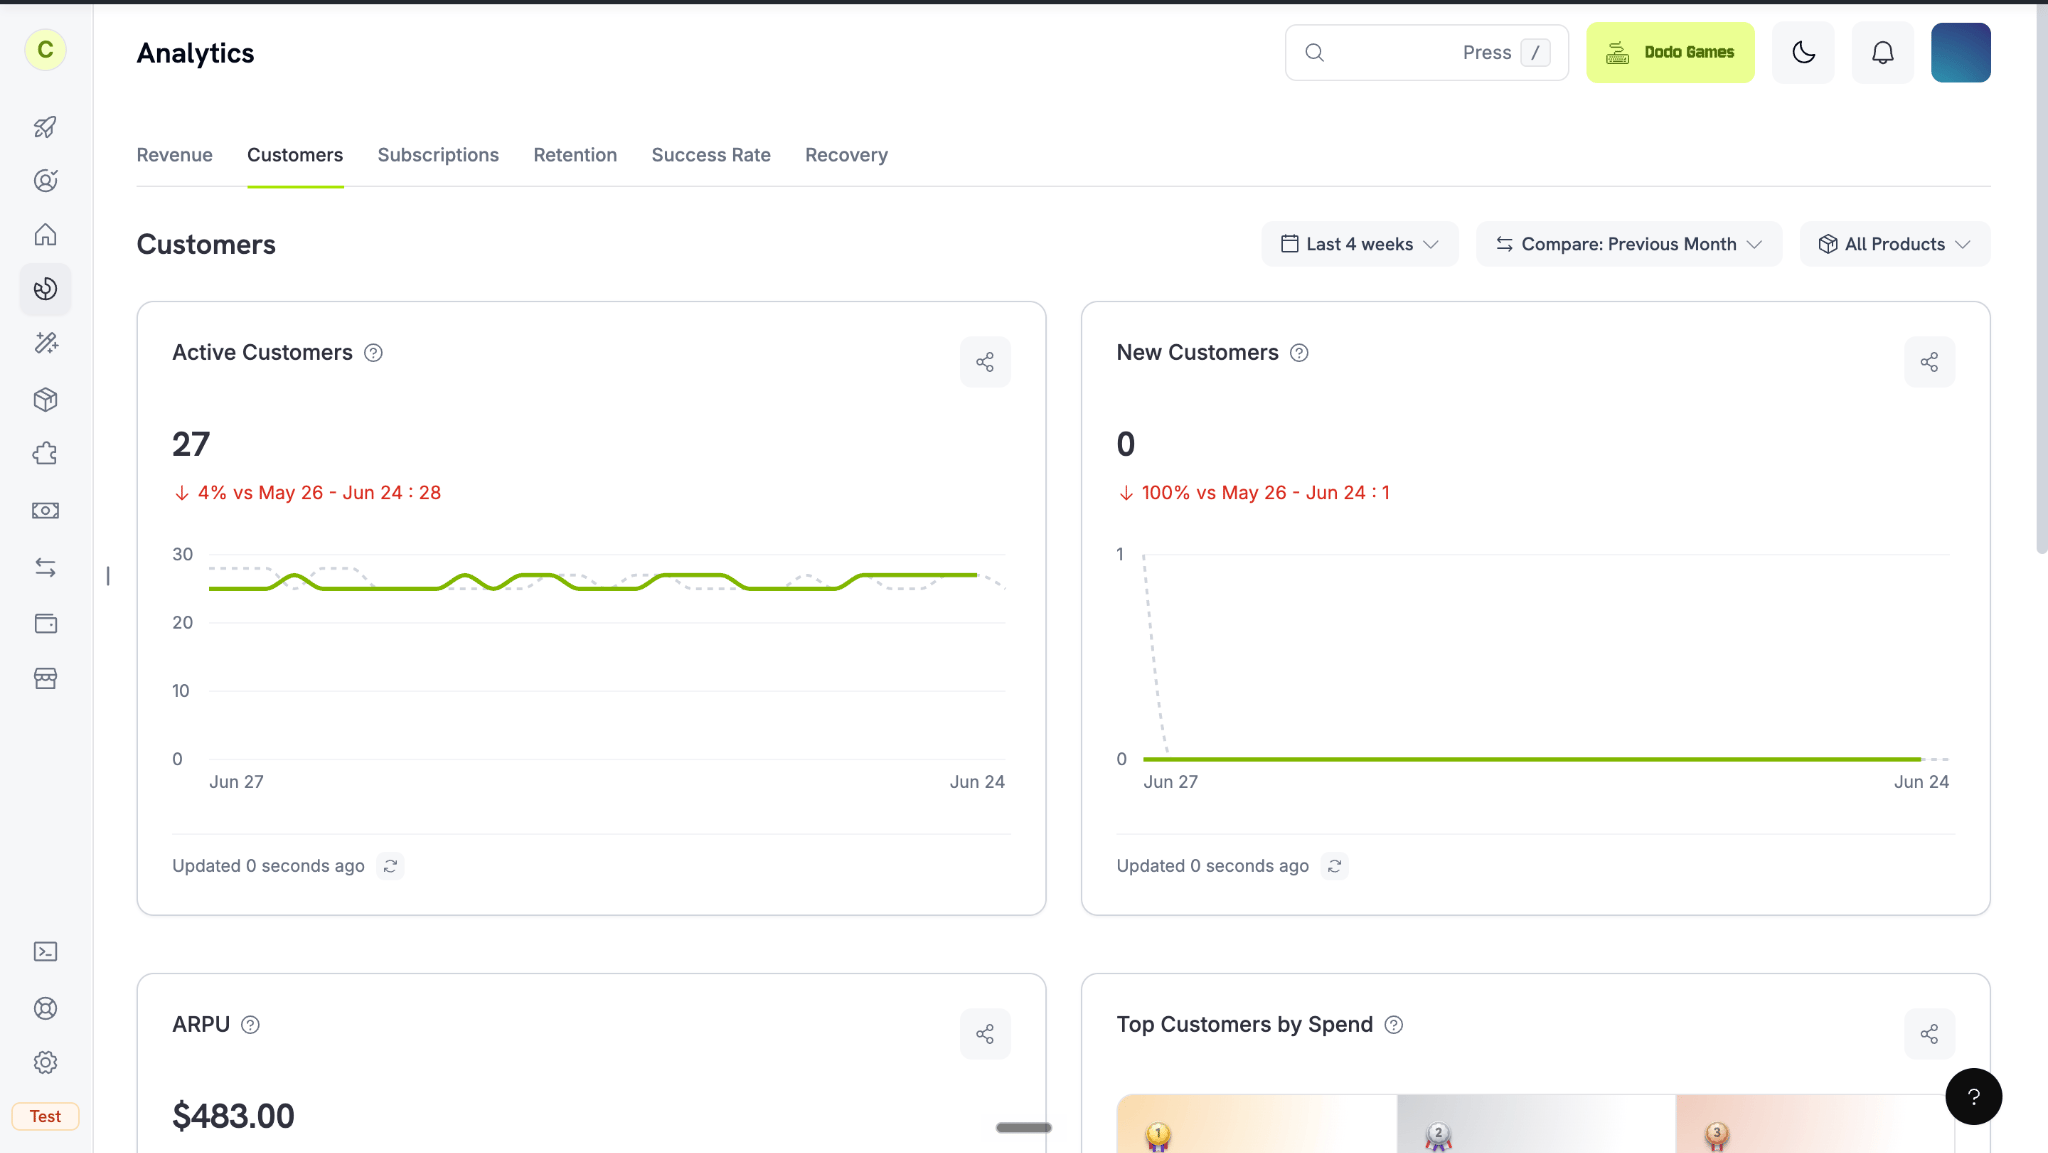
Customers tab showing active customers, new customers, ARPU, and top customers by spend

Customers tab: active and new customers, ARPU, and top customers

고객 확보, 유지 및 지출 패턴을 분석합니다.

Subscriptions Tab

반복 revenue를 모니터링하고 Monthly Recurring Revenue (MRR)가 시간에 따라 어떻게 변하는지 확인합니다.
MRR은 각 subscription을 별도로 집계하므로 concurrent subscriptions를 보유한 고객은 모든 subscription이 포함됩니다. 각 subscription은 add-on을 포함한 recurring amount를 월간 rate로 환산하여 추가합니다. Trial은 전환될 때까지 아무것도 추가하지 않으며, usage-based subscription은 고정된 base price만 추가합니다.

Retention Tab

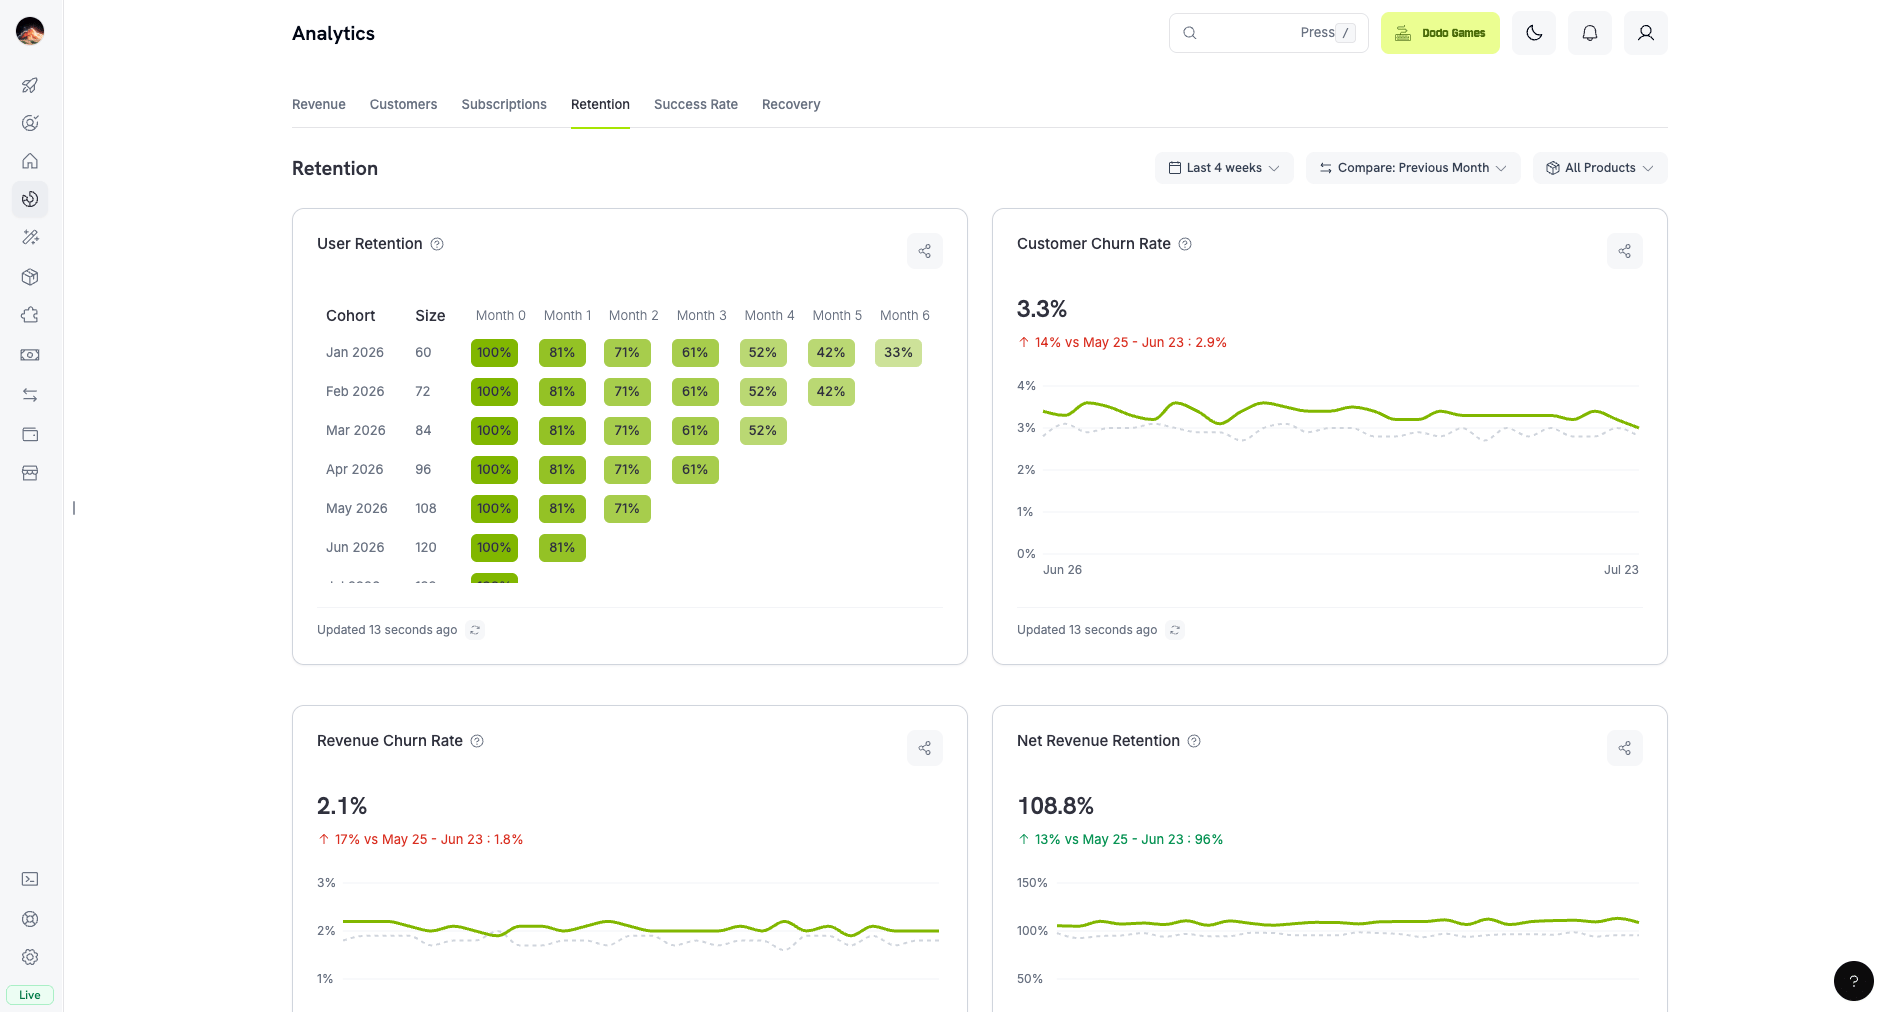
Retention tab showing the user retention cohort matrix, customer churn rate, revenue churn rate, and net revenue retention

Retention tab: churn rates, retention matrix, and NRR/GRR

고객 retention 및 churn 패턴을 모니터링합니다.

Success Rate Tab

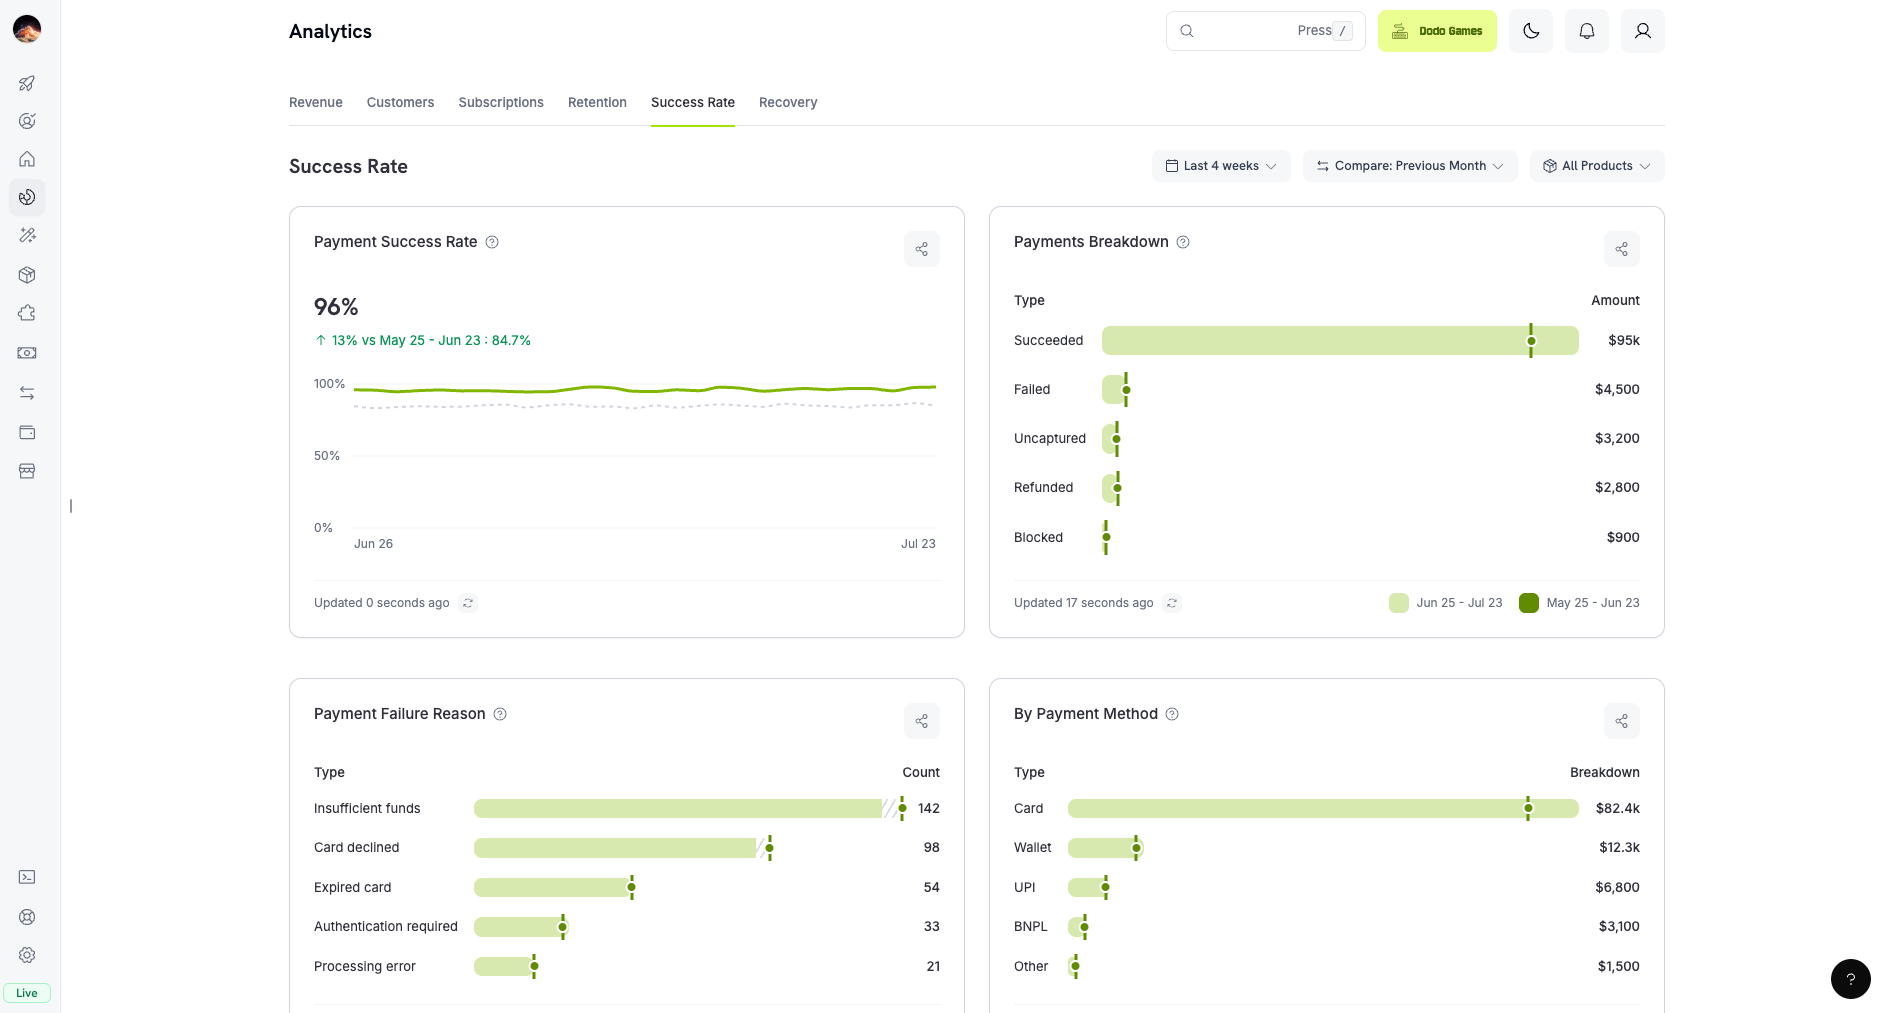
Success Rate tab showing payment success rate, payments breakdown, payment failure reasons, and success by payment method

Success Rate tab: payment and refund success rates with failure analysis

payment 및 refund success rate를 모니터링하여 transaction 문제를 찾고 해결합니다.

Transaction Failure Reference

모든 transaction failure code와 해당 사유입니다.
success rate가 하락하거나 failure가 급증하면 failure 사유를 검토하고 신속하게 해결하여 revenue 손실을 제한하세요.

Recovery Tab

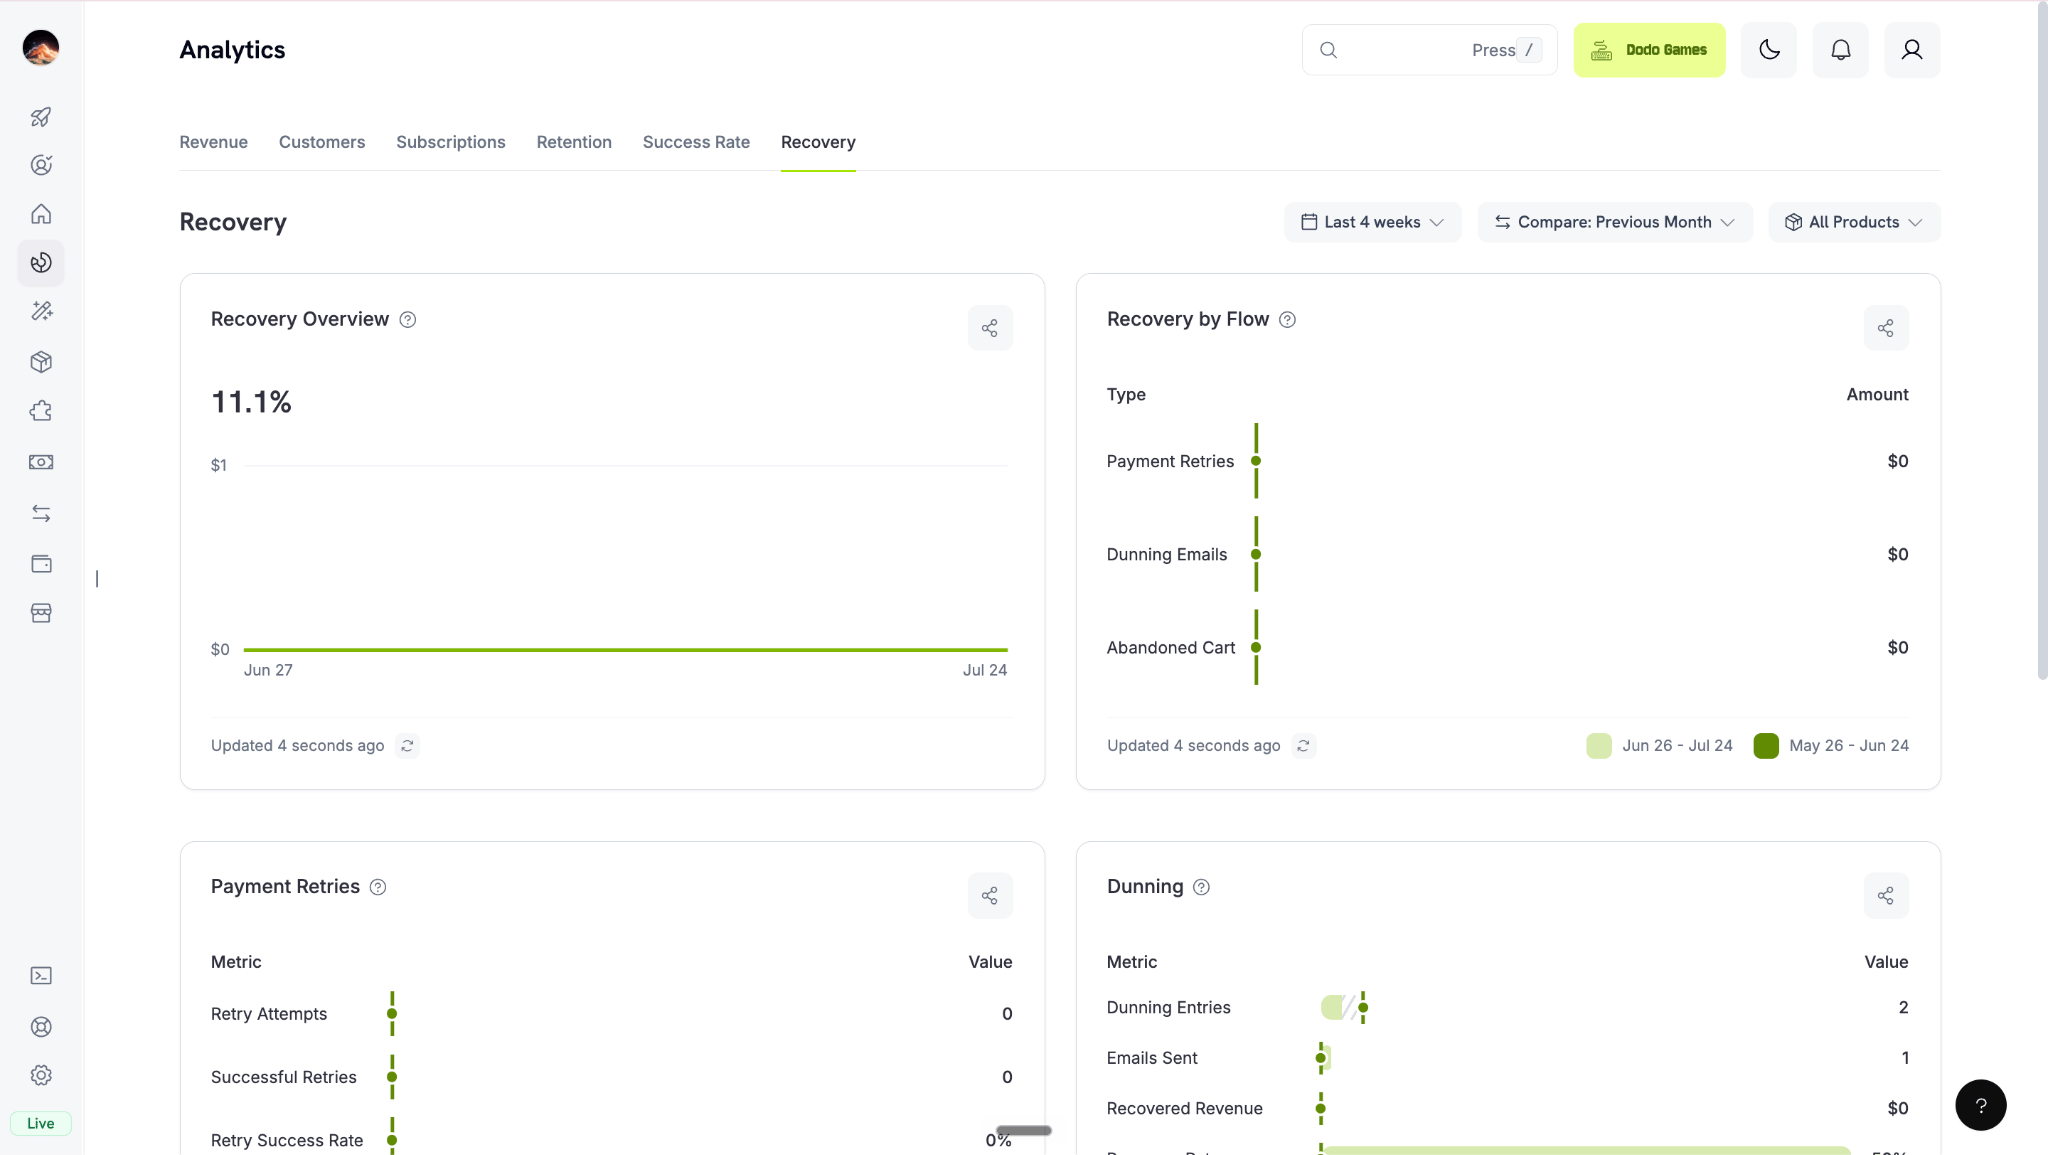
Recovery tab showing recovery overview, recovery by flow, payment retries, and dunning metrics

Recovery tab: retries, dunning, and abandoned cart recovery

자동 payment retry, dunning email 및 abandoned cart recovery를 통해 Dodo Payments가 회수하는 revenue를 추적합니다.

Recovery Features

payment retry, dunning 및 abandoned cart recovery를 구성합니다.

Product-Level Analytics

한 product의 analytics를 확인하려면 Products로 이동하여 product를 선택하세요. product page에는 해당 product로 범위가 지정된 Analytics와 동일한 card가 표시됩니다.
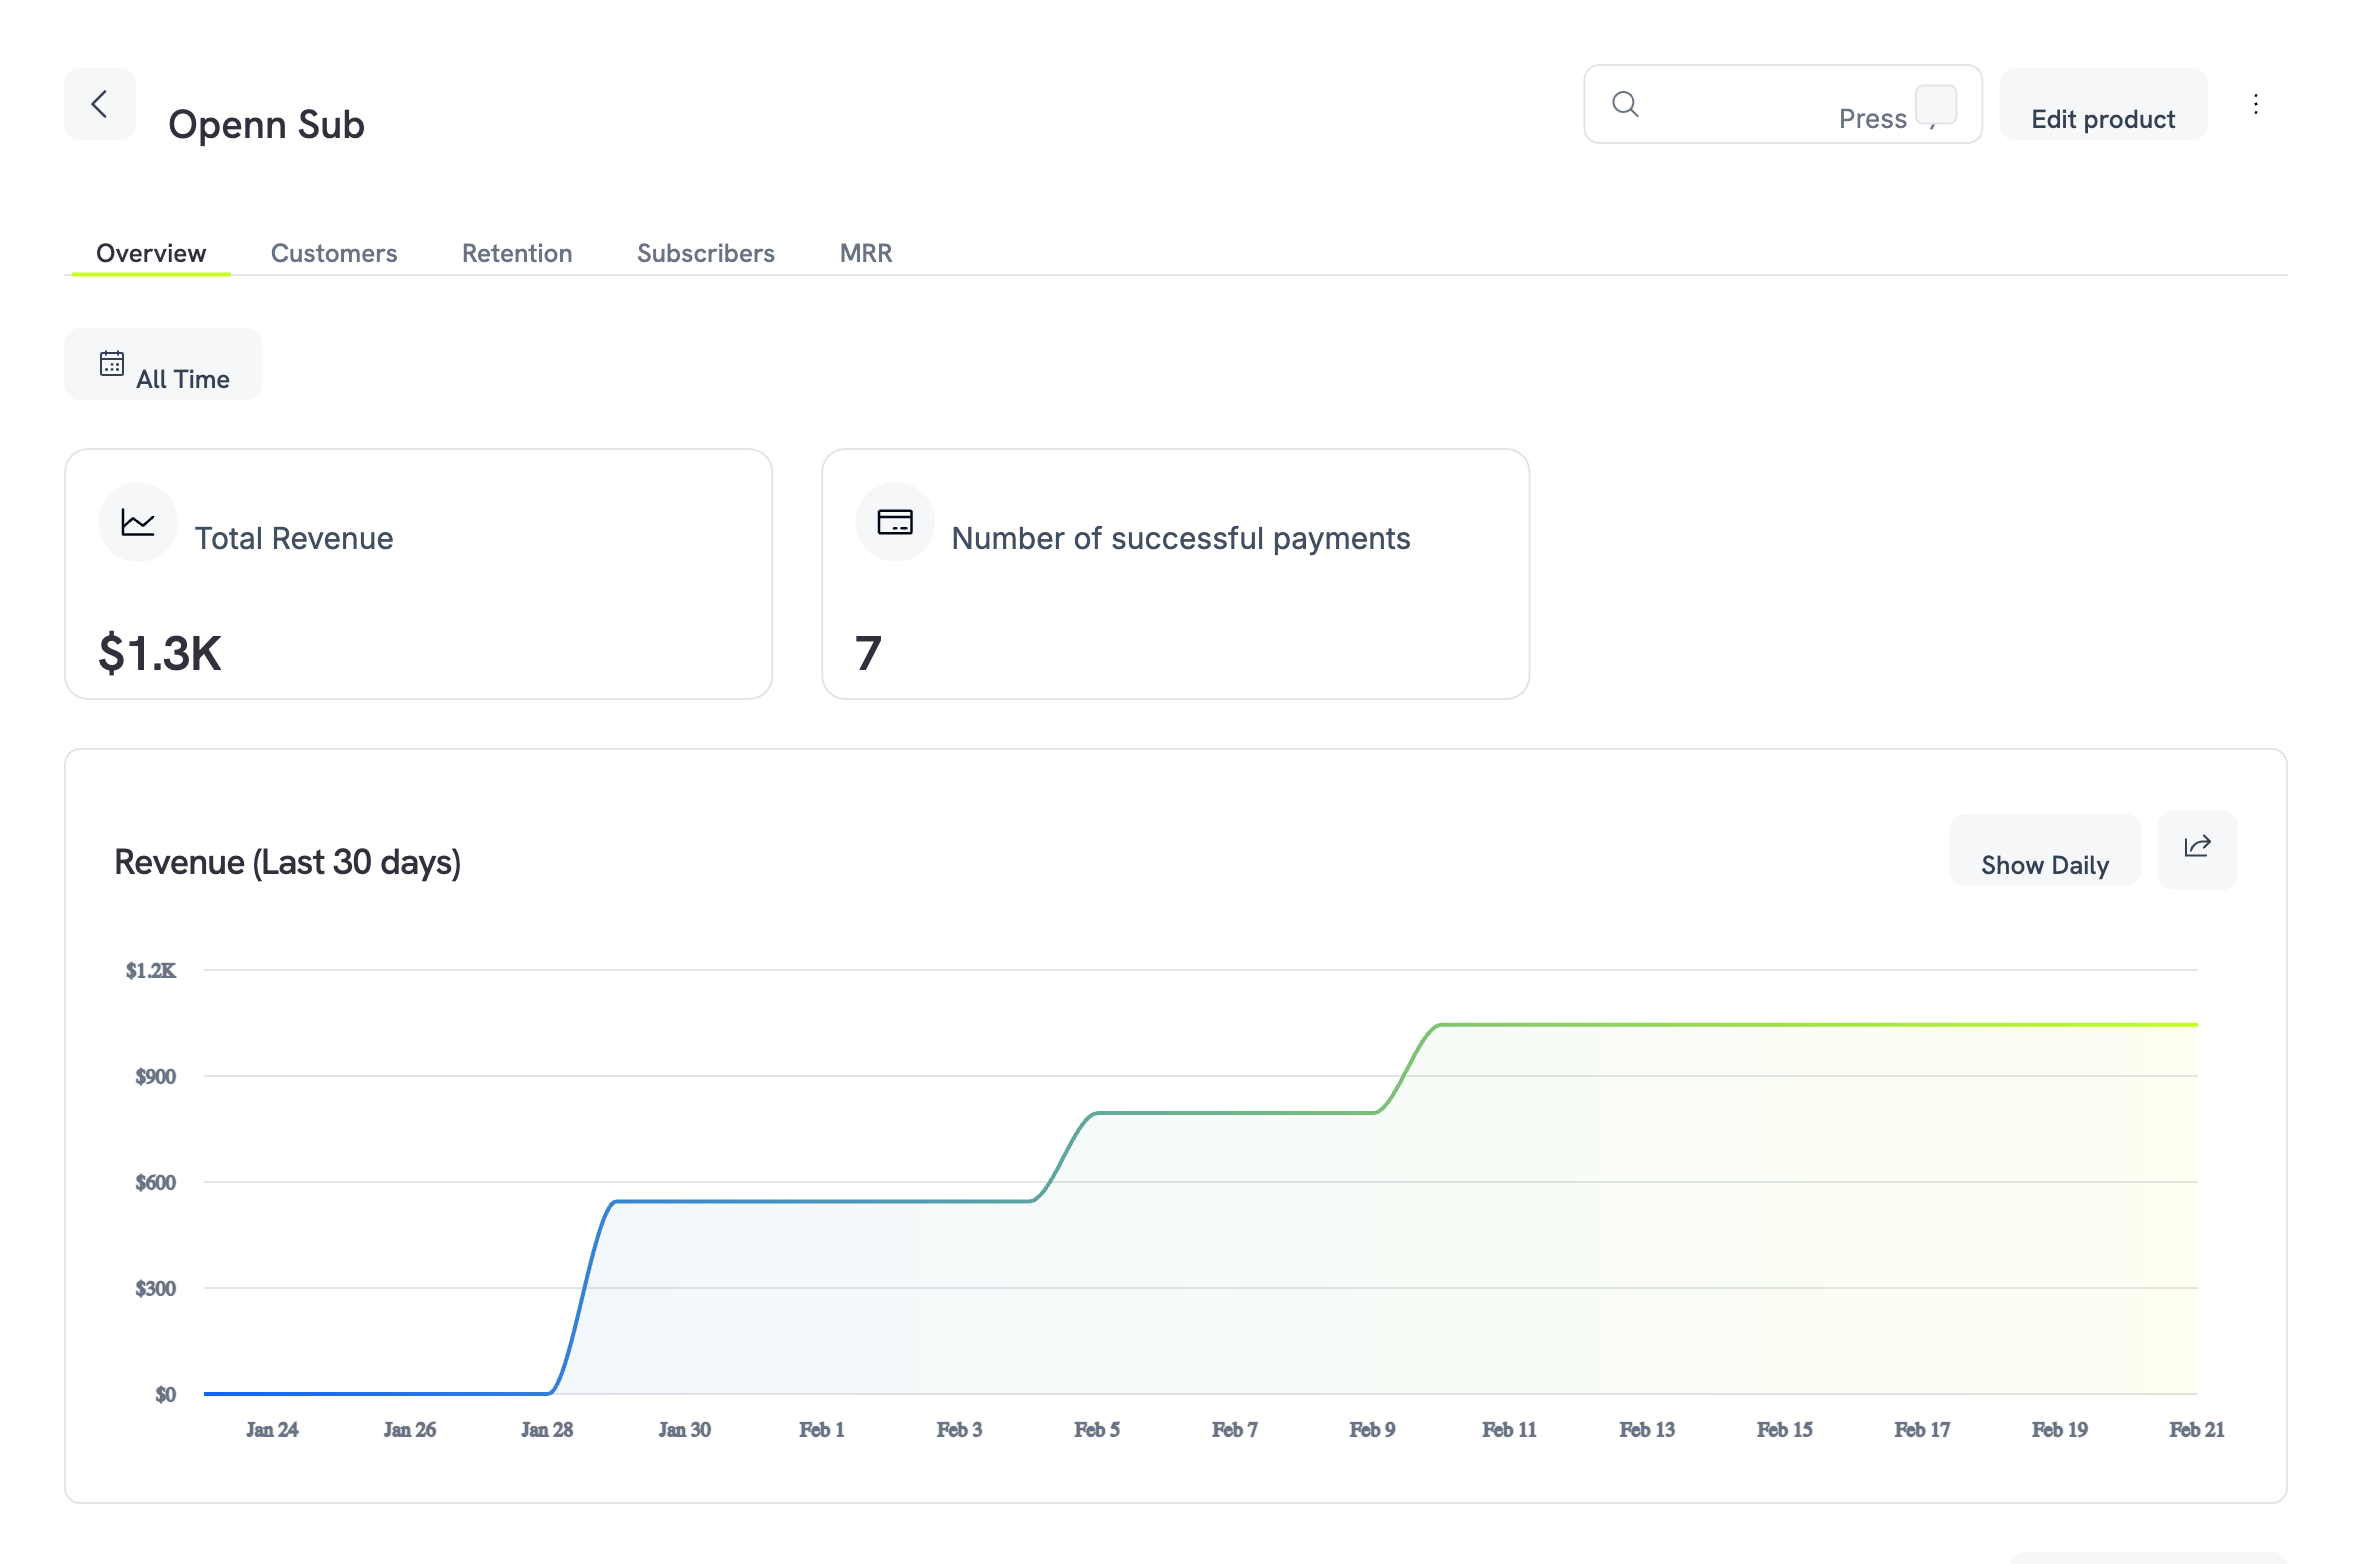
Product analytics overview tab with total revenue, successful payments, and revenue trend chart

Product analytics overview showing revenue summary and trend chart

product page에는 5개의 tab이 있습니다. Subscribers와 MRR은 subscription product에만 표시됩니다.

Overview

Revenue card와 product의 transaction 및 discount입니다.

Customers

이 product의 customer card이며, spend 기준 상위 customer를 포함합니다.

Retention

이 product의 churn, retention 및 trial conversion입니다.

Subscribers

status 및 billing detail이 포함된 모든 subscription입니다.

MRR

Monthly Recurring Revenue 분석: new, expansion, contraction, churned 및 net입니다.
하나의 filter bar에서 모든 tab의 기간과 비교 기준을 설정합니다. 기본값은 Last 30 days이며, 이 business에서 마지막으로 사용한 범위가 있으면 해당 범위로 시작합니다.

Overview Tab

Overview tab에는 product의 Revenue card인 Gross Volume, Net Volume, Payments Count, Payments Breakdown, Average Order Value 및 Revenue By Country가 표시됩니다. 각 metric의 정의는 Revenue Tab에서 확인할 수 있습니다. card 아래의 Transactions table에는 이 product의 모든 payment가 표시됩니다: 추가 column에는 customer, subscription, currency, invoice, card, refund status 및 dispute status detail이 표시됩니다.
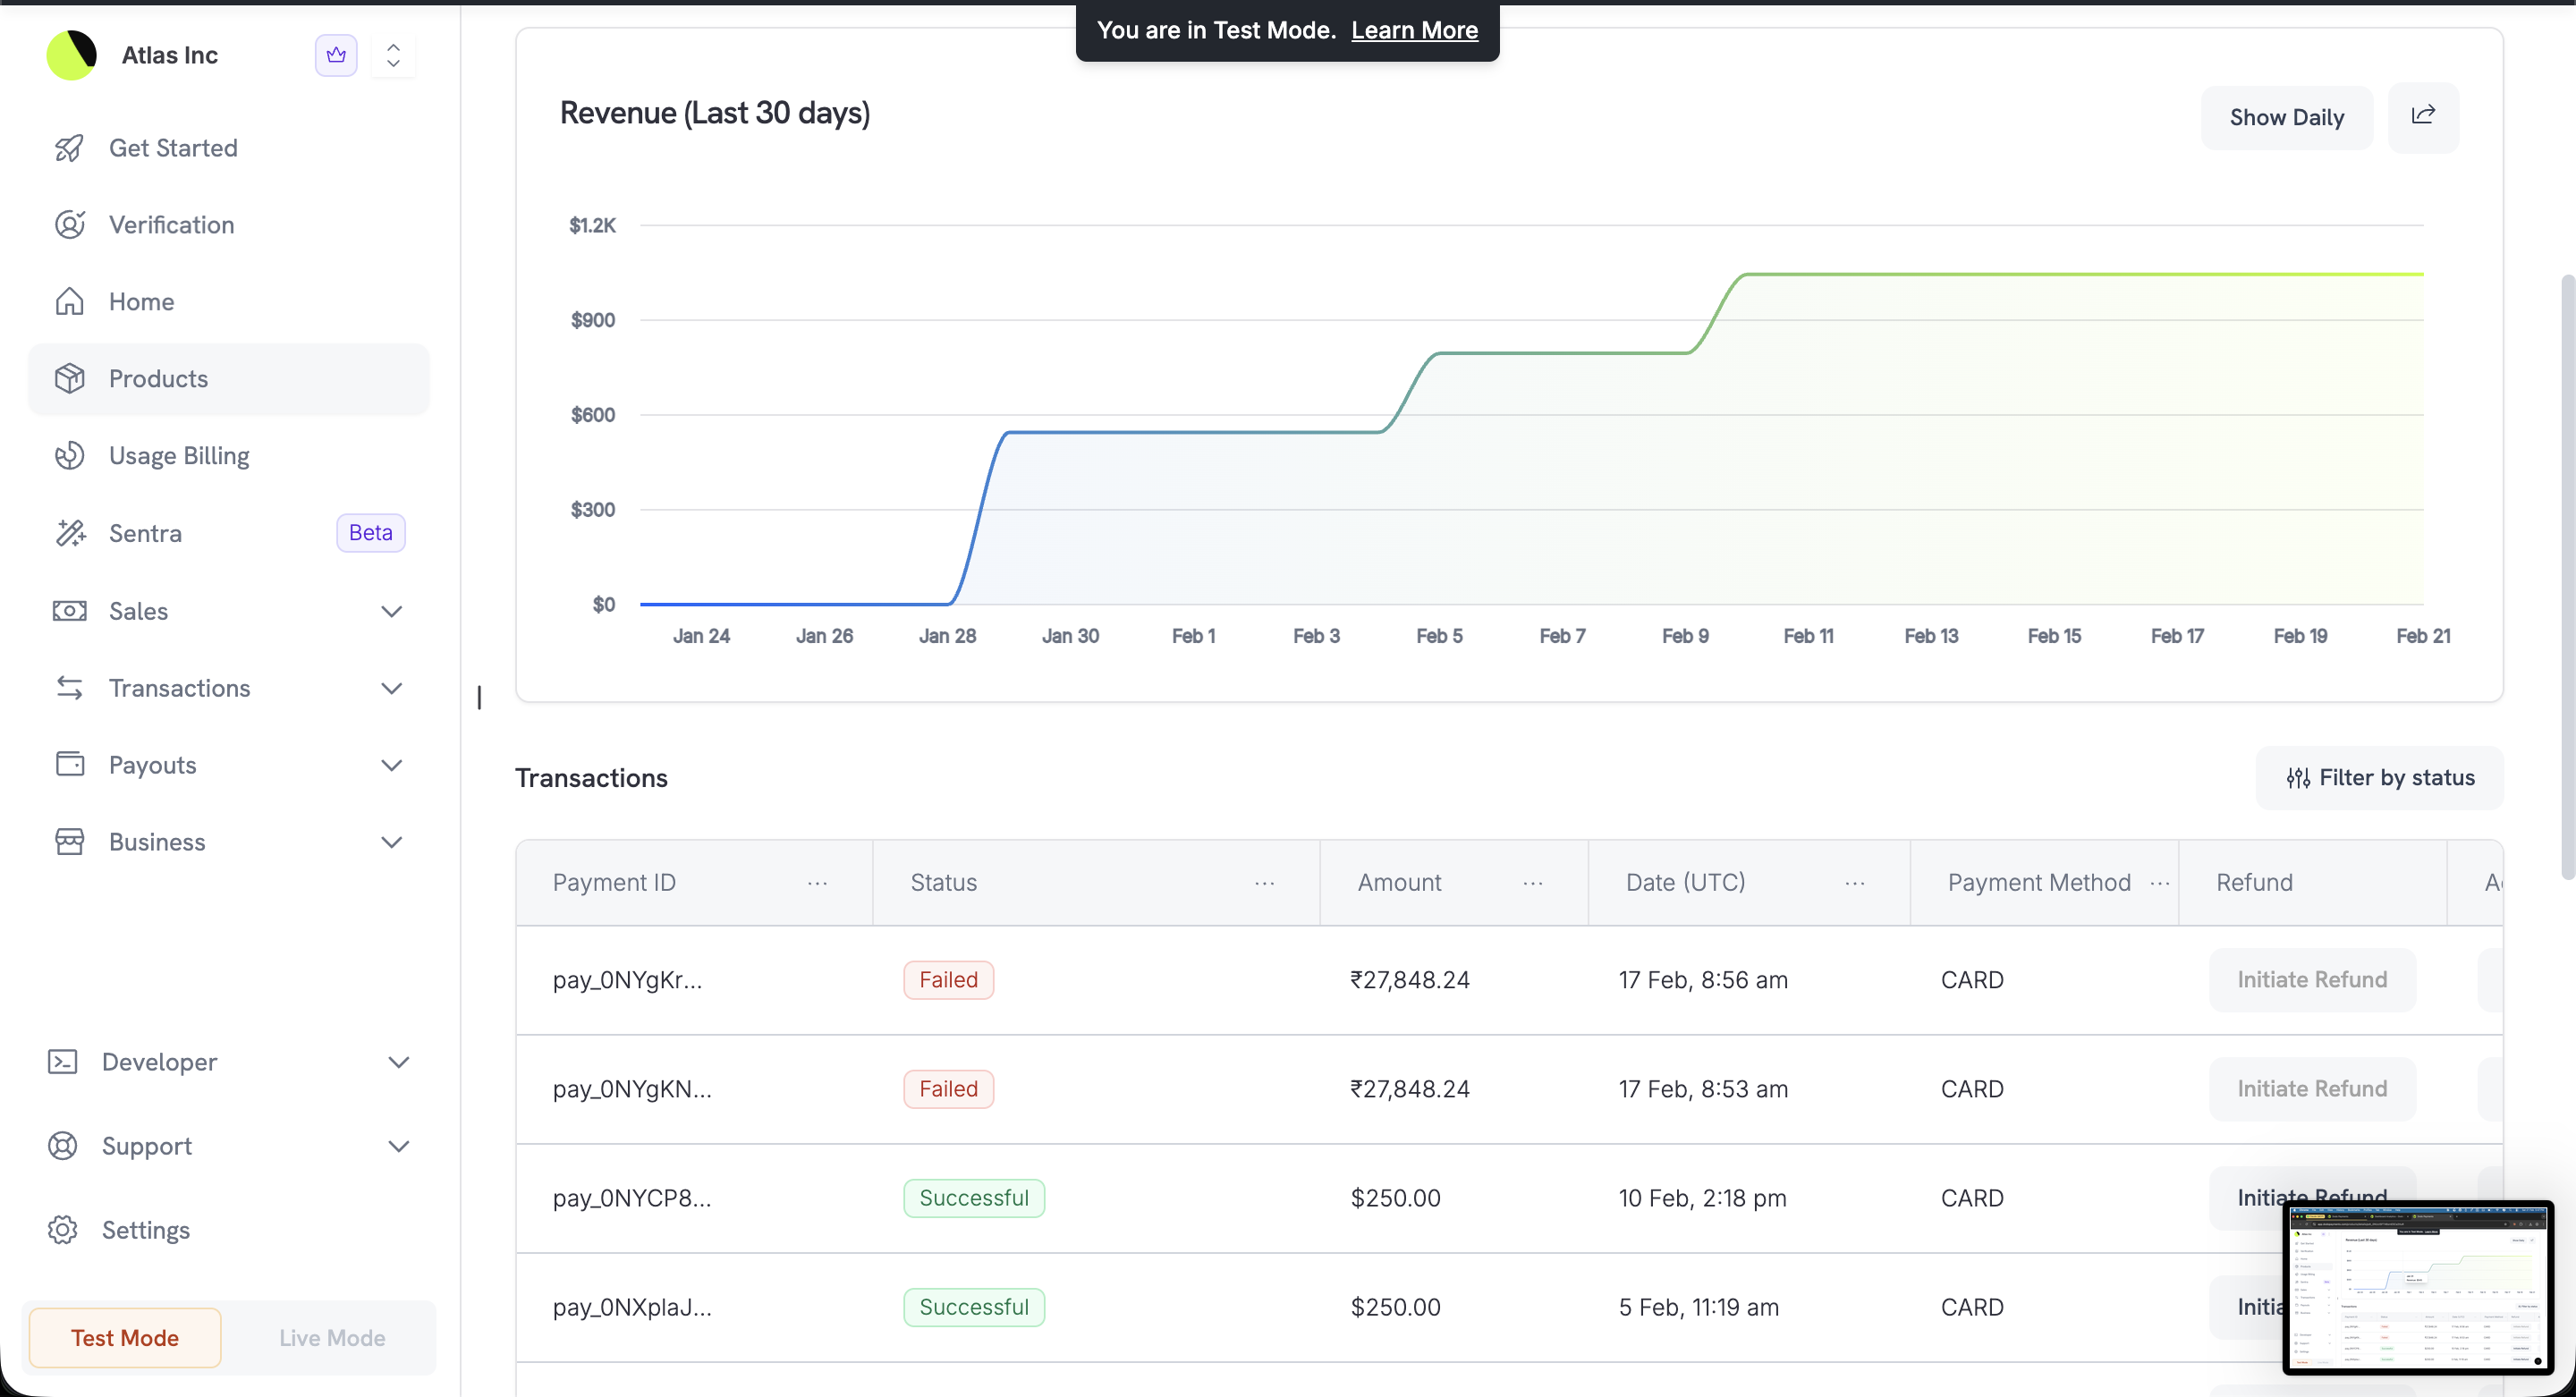
Product transactions table with payment IDs, statuses, amounts, and refund actions

Transactions table showing payment history for the product

status로 목록을 좁히려면 Filter by status를 클릭하고 Not initiated, In progress, On hold, Failed 또는 Success를 선택하세요. transaction 다음에는 Discounts table이 표시됩니다.

Customers Tab

이 product를 구매하는 고객과 고객의 지출 금액을 확인합니다.
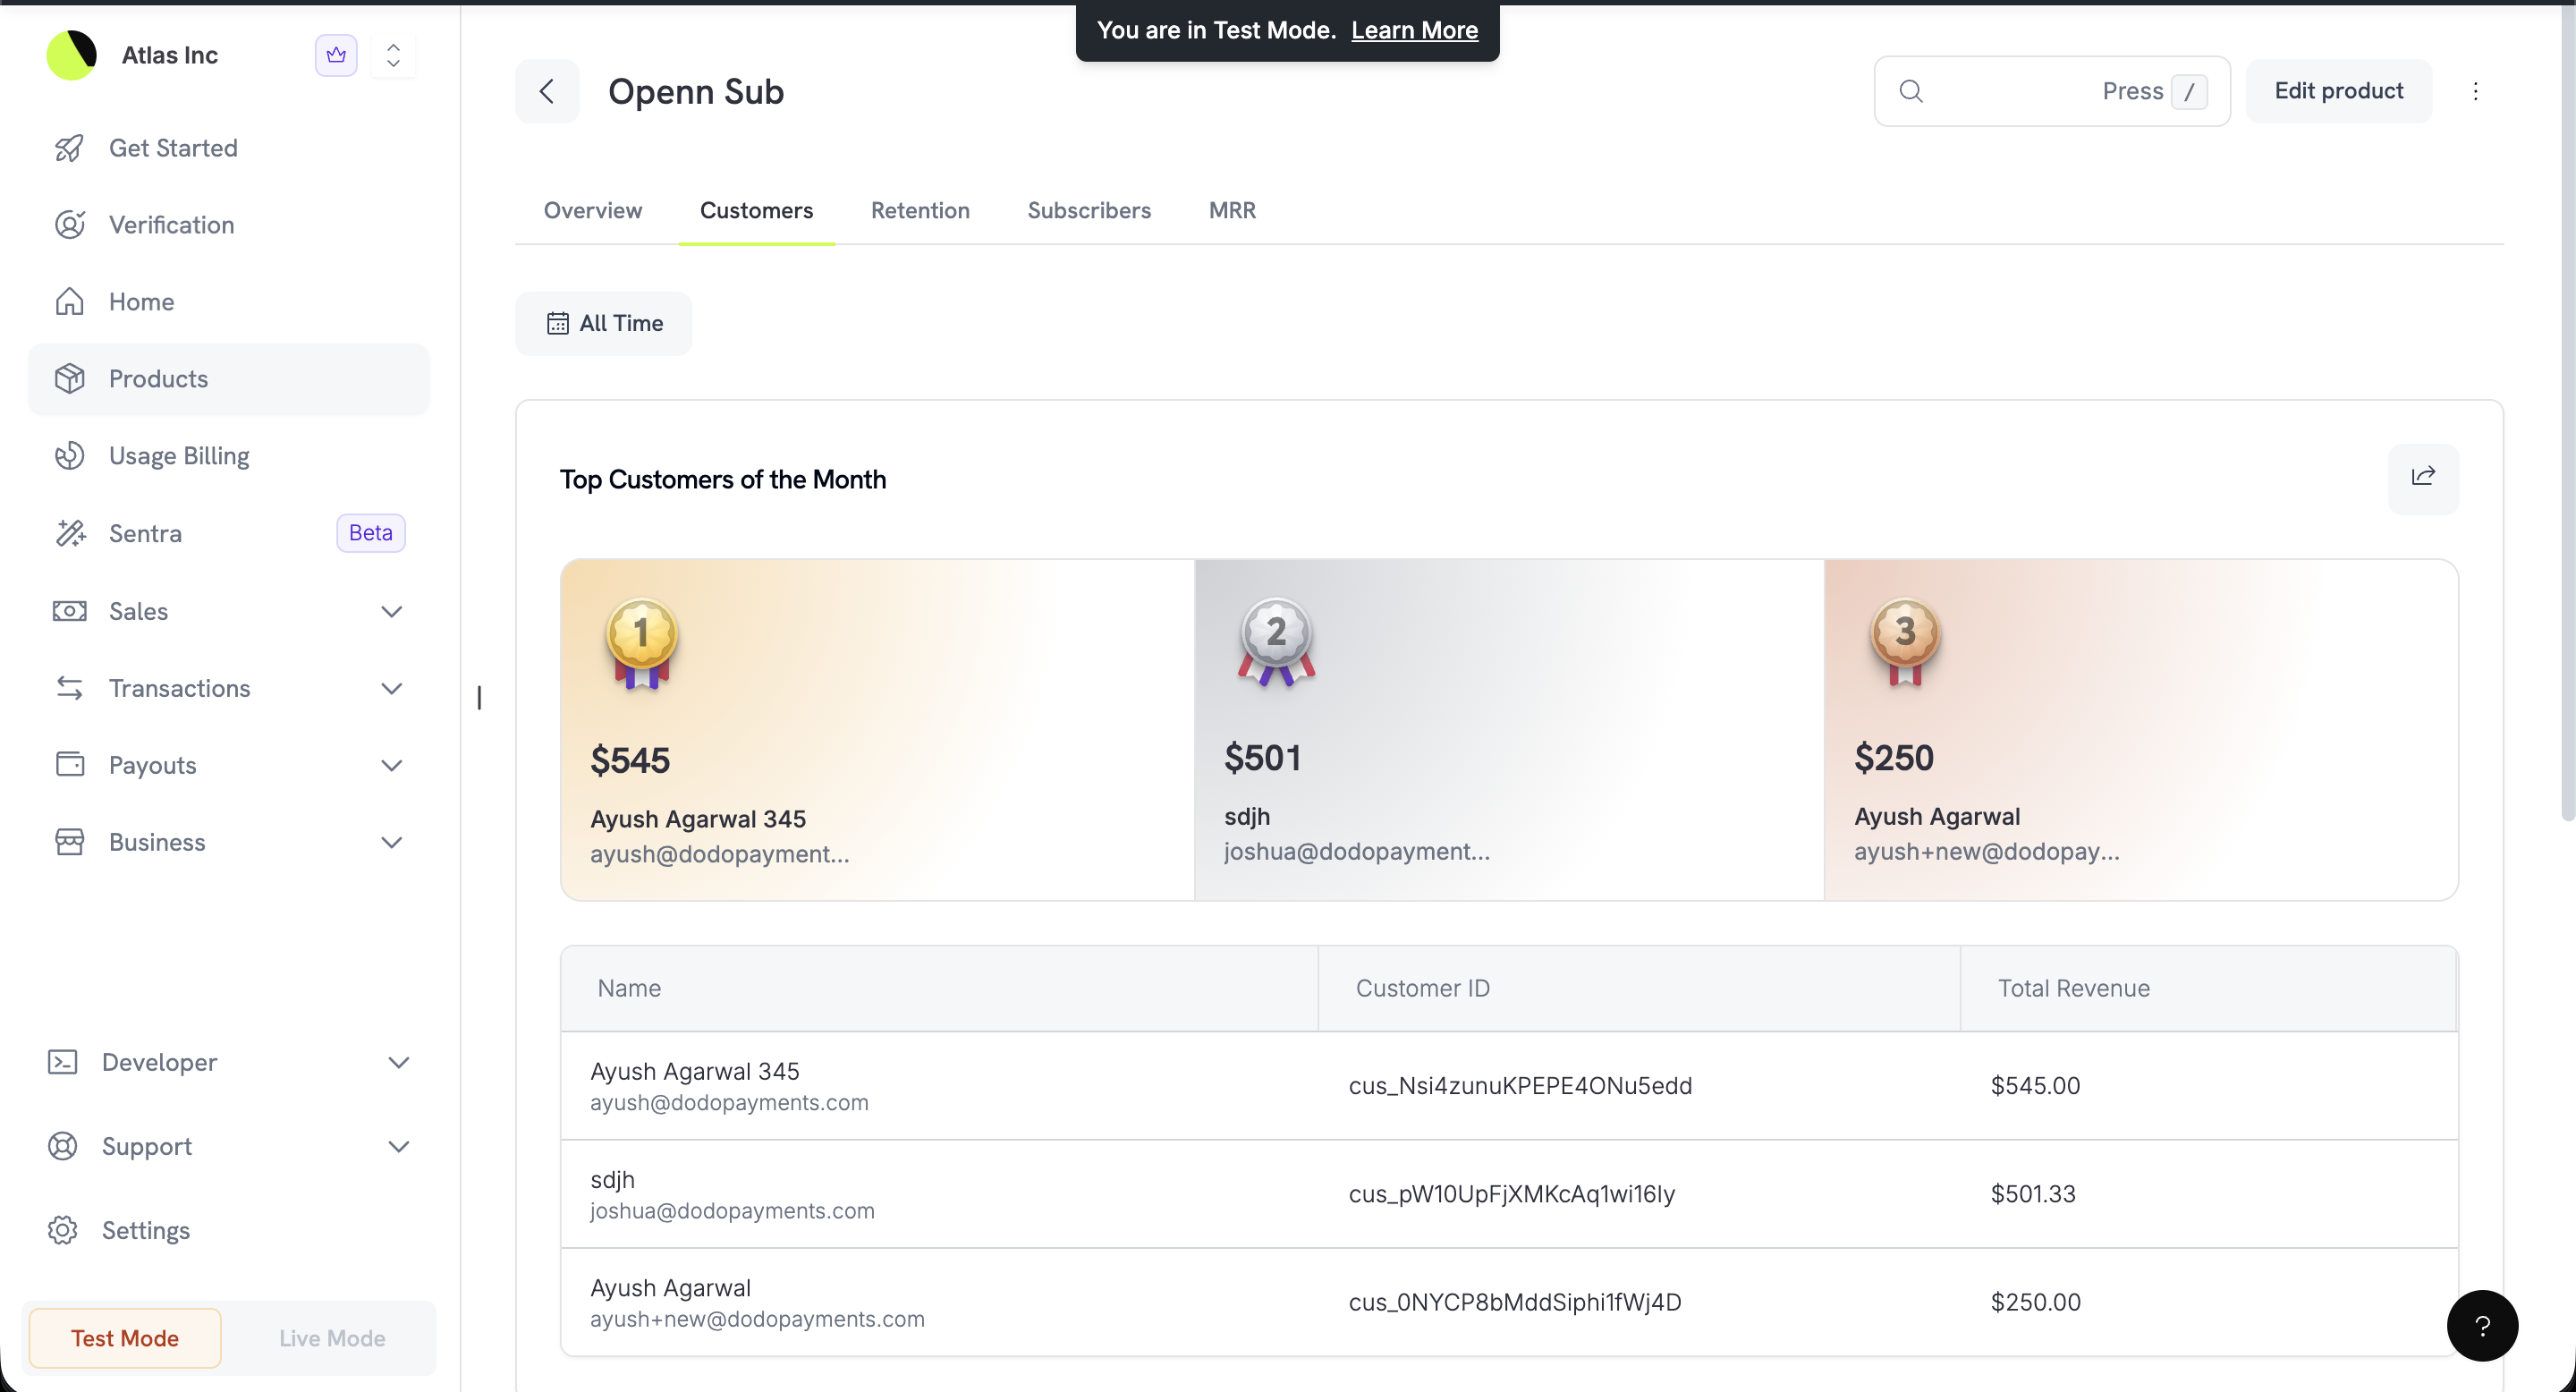
Customers tab showing top 3 customers ranked by revenue with a detailed breakdown table

Top customers of the month with podium ranking and customer table

Customers tab에는 product의 customer card인 Active Customers, New Customers, ARPU, Top Customers by Spend, New VS Returning 및 **LTV (model)**이 표시됩니다. Top Customers by Spend는 이 product가 고객으로부터 얻은 revenue를 기준으로 고객을 정렬합니다. Analytics의 Customers Tab에서 각 metric을 정의합니다.

Retention Tab

이 product가 subscriber를 얼마나 잘 유지하는지 확인합니다.
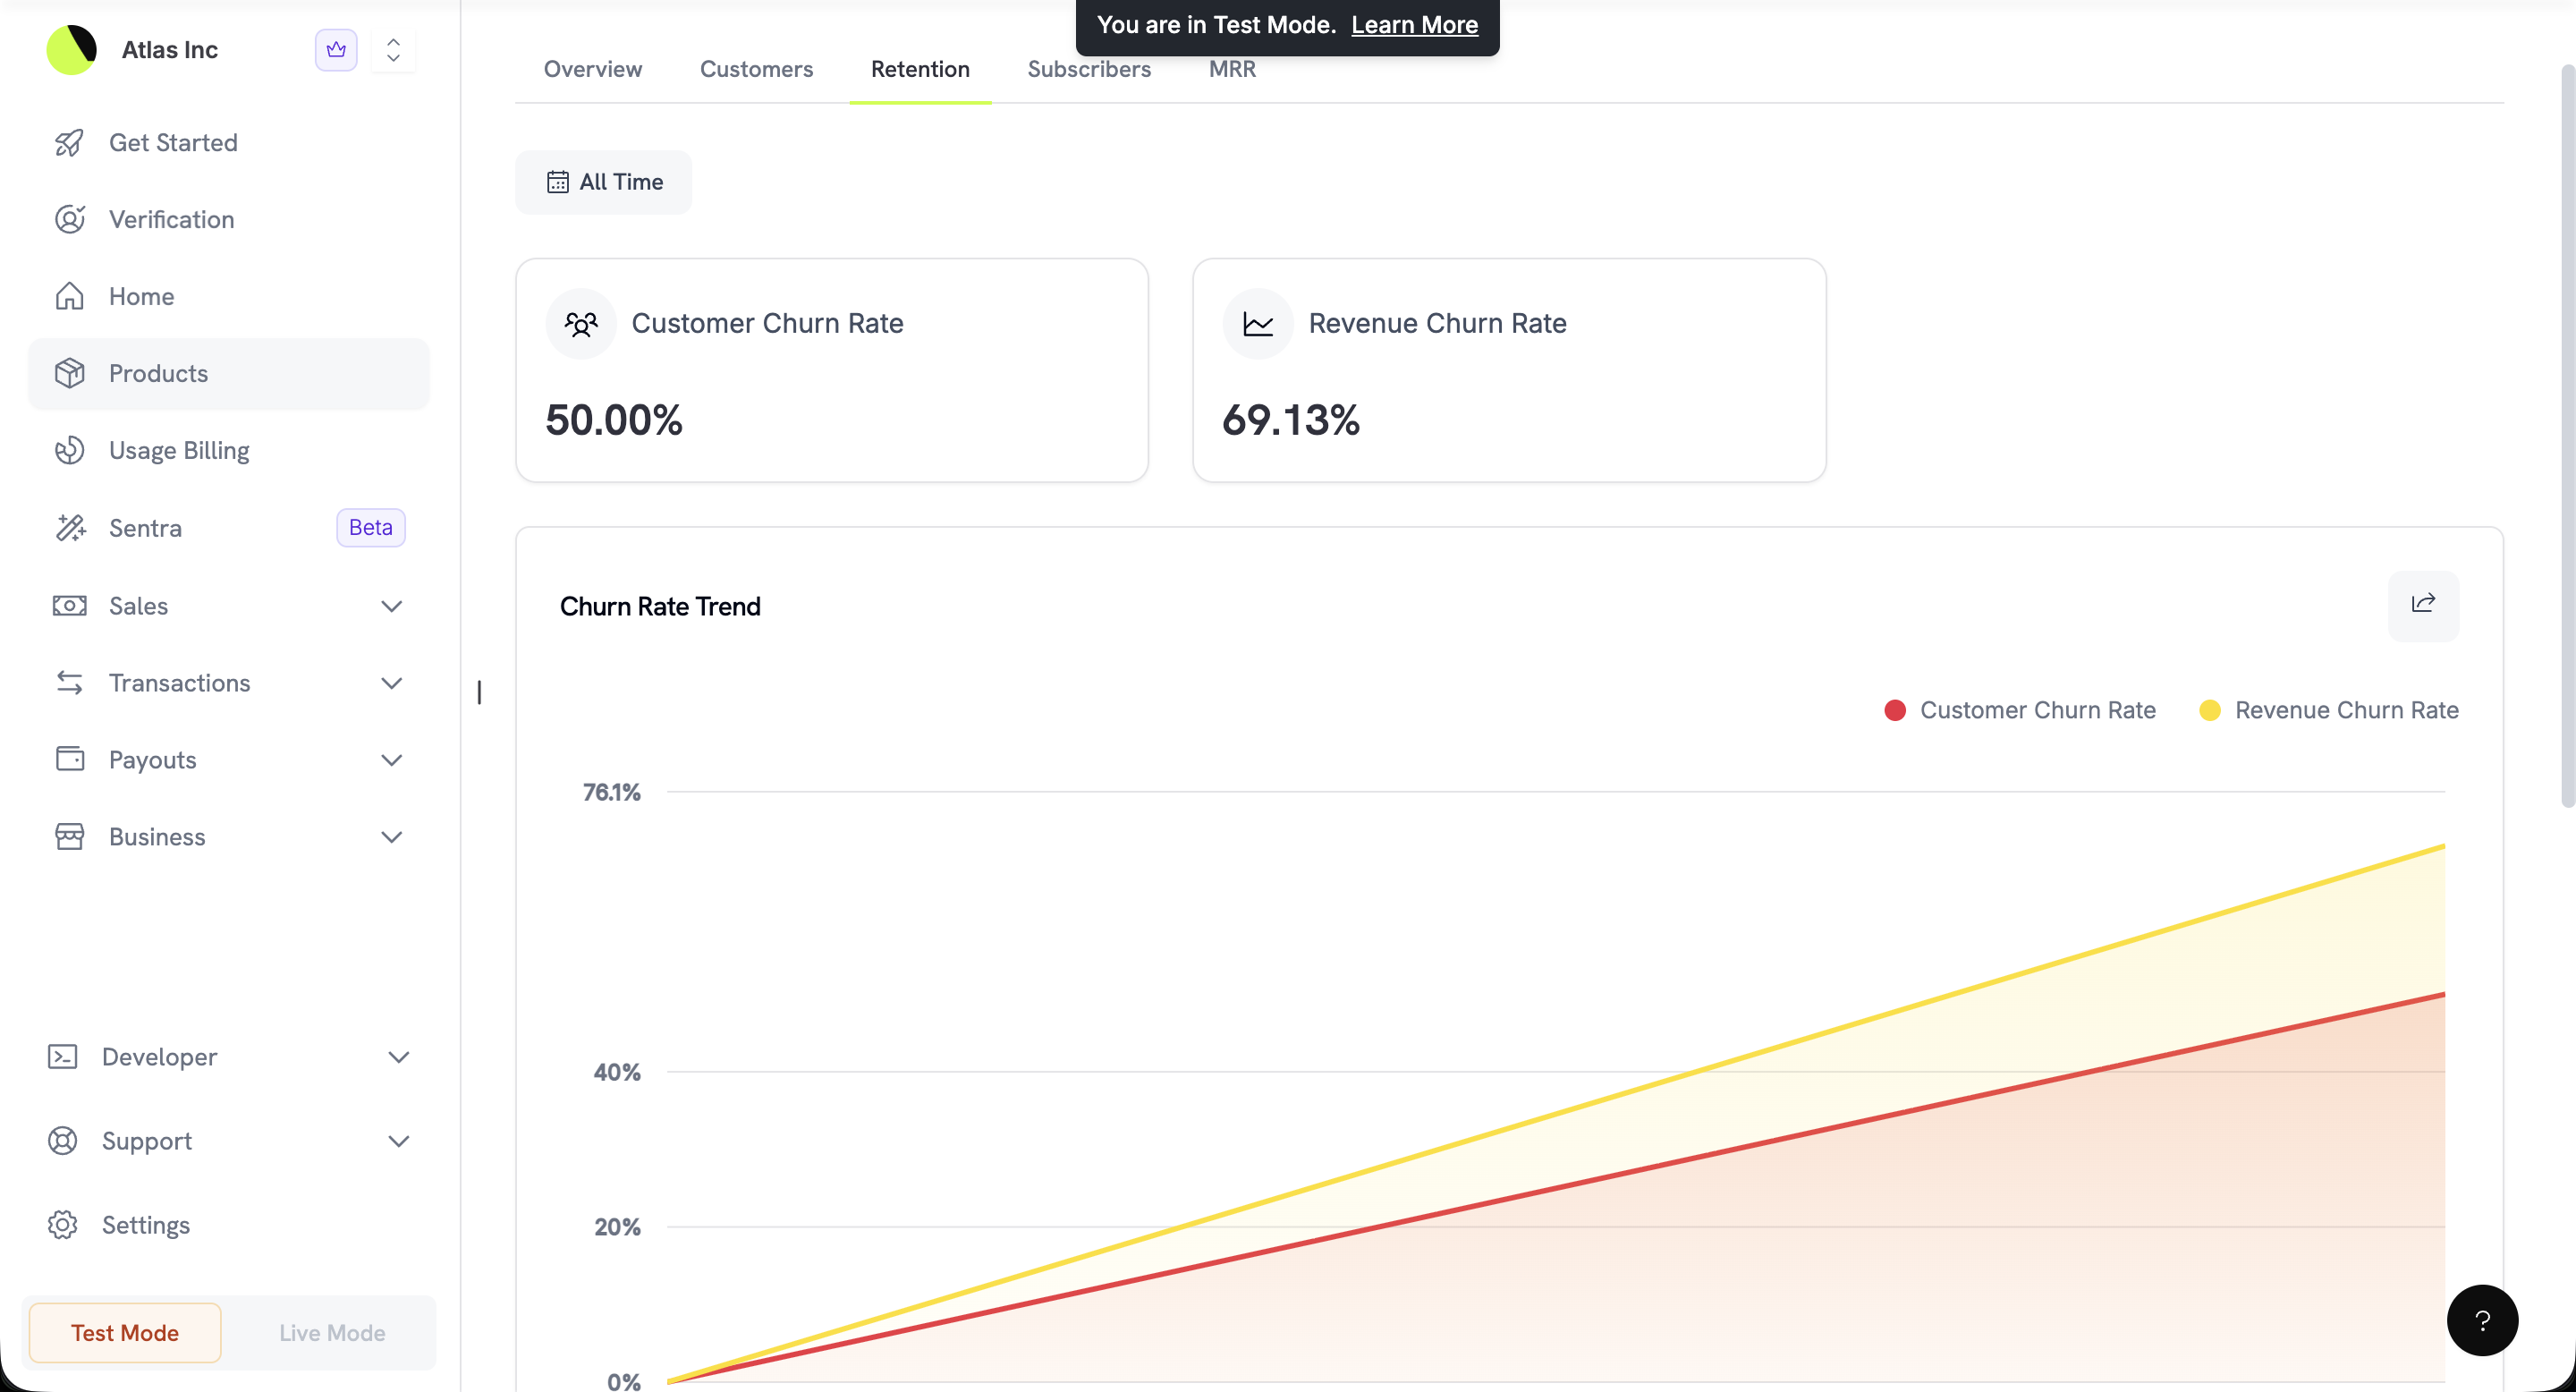
Retention tab showing customer churn rate, revenue churn rate, and churn rate trend chart

Customer and revenue churn rates with trend analysis

Retention tab에는 product의 retention card인 User Retention, Customer Churn Rate, Revenue Churn Rate, Net Revenue Retention, Gross Revenue Retention 및 Trial Conversion이 표시됩니다. Customer churn rate는 취소한 subscriber의 비율입니다. Revenue churn rate는 취소로 인해 손실된 MRR의 비율입니다. 두 지표를 시간에 따라 추적하여 추세를 조기에 파악하고 대응하세요.

Subscribers Tab

선택한 기간에 생성된 이 product의 subscription 목록입니다.
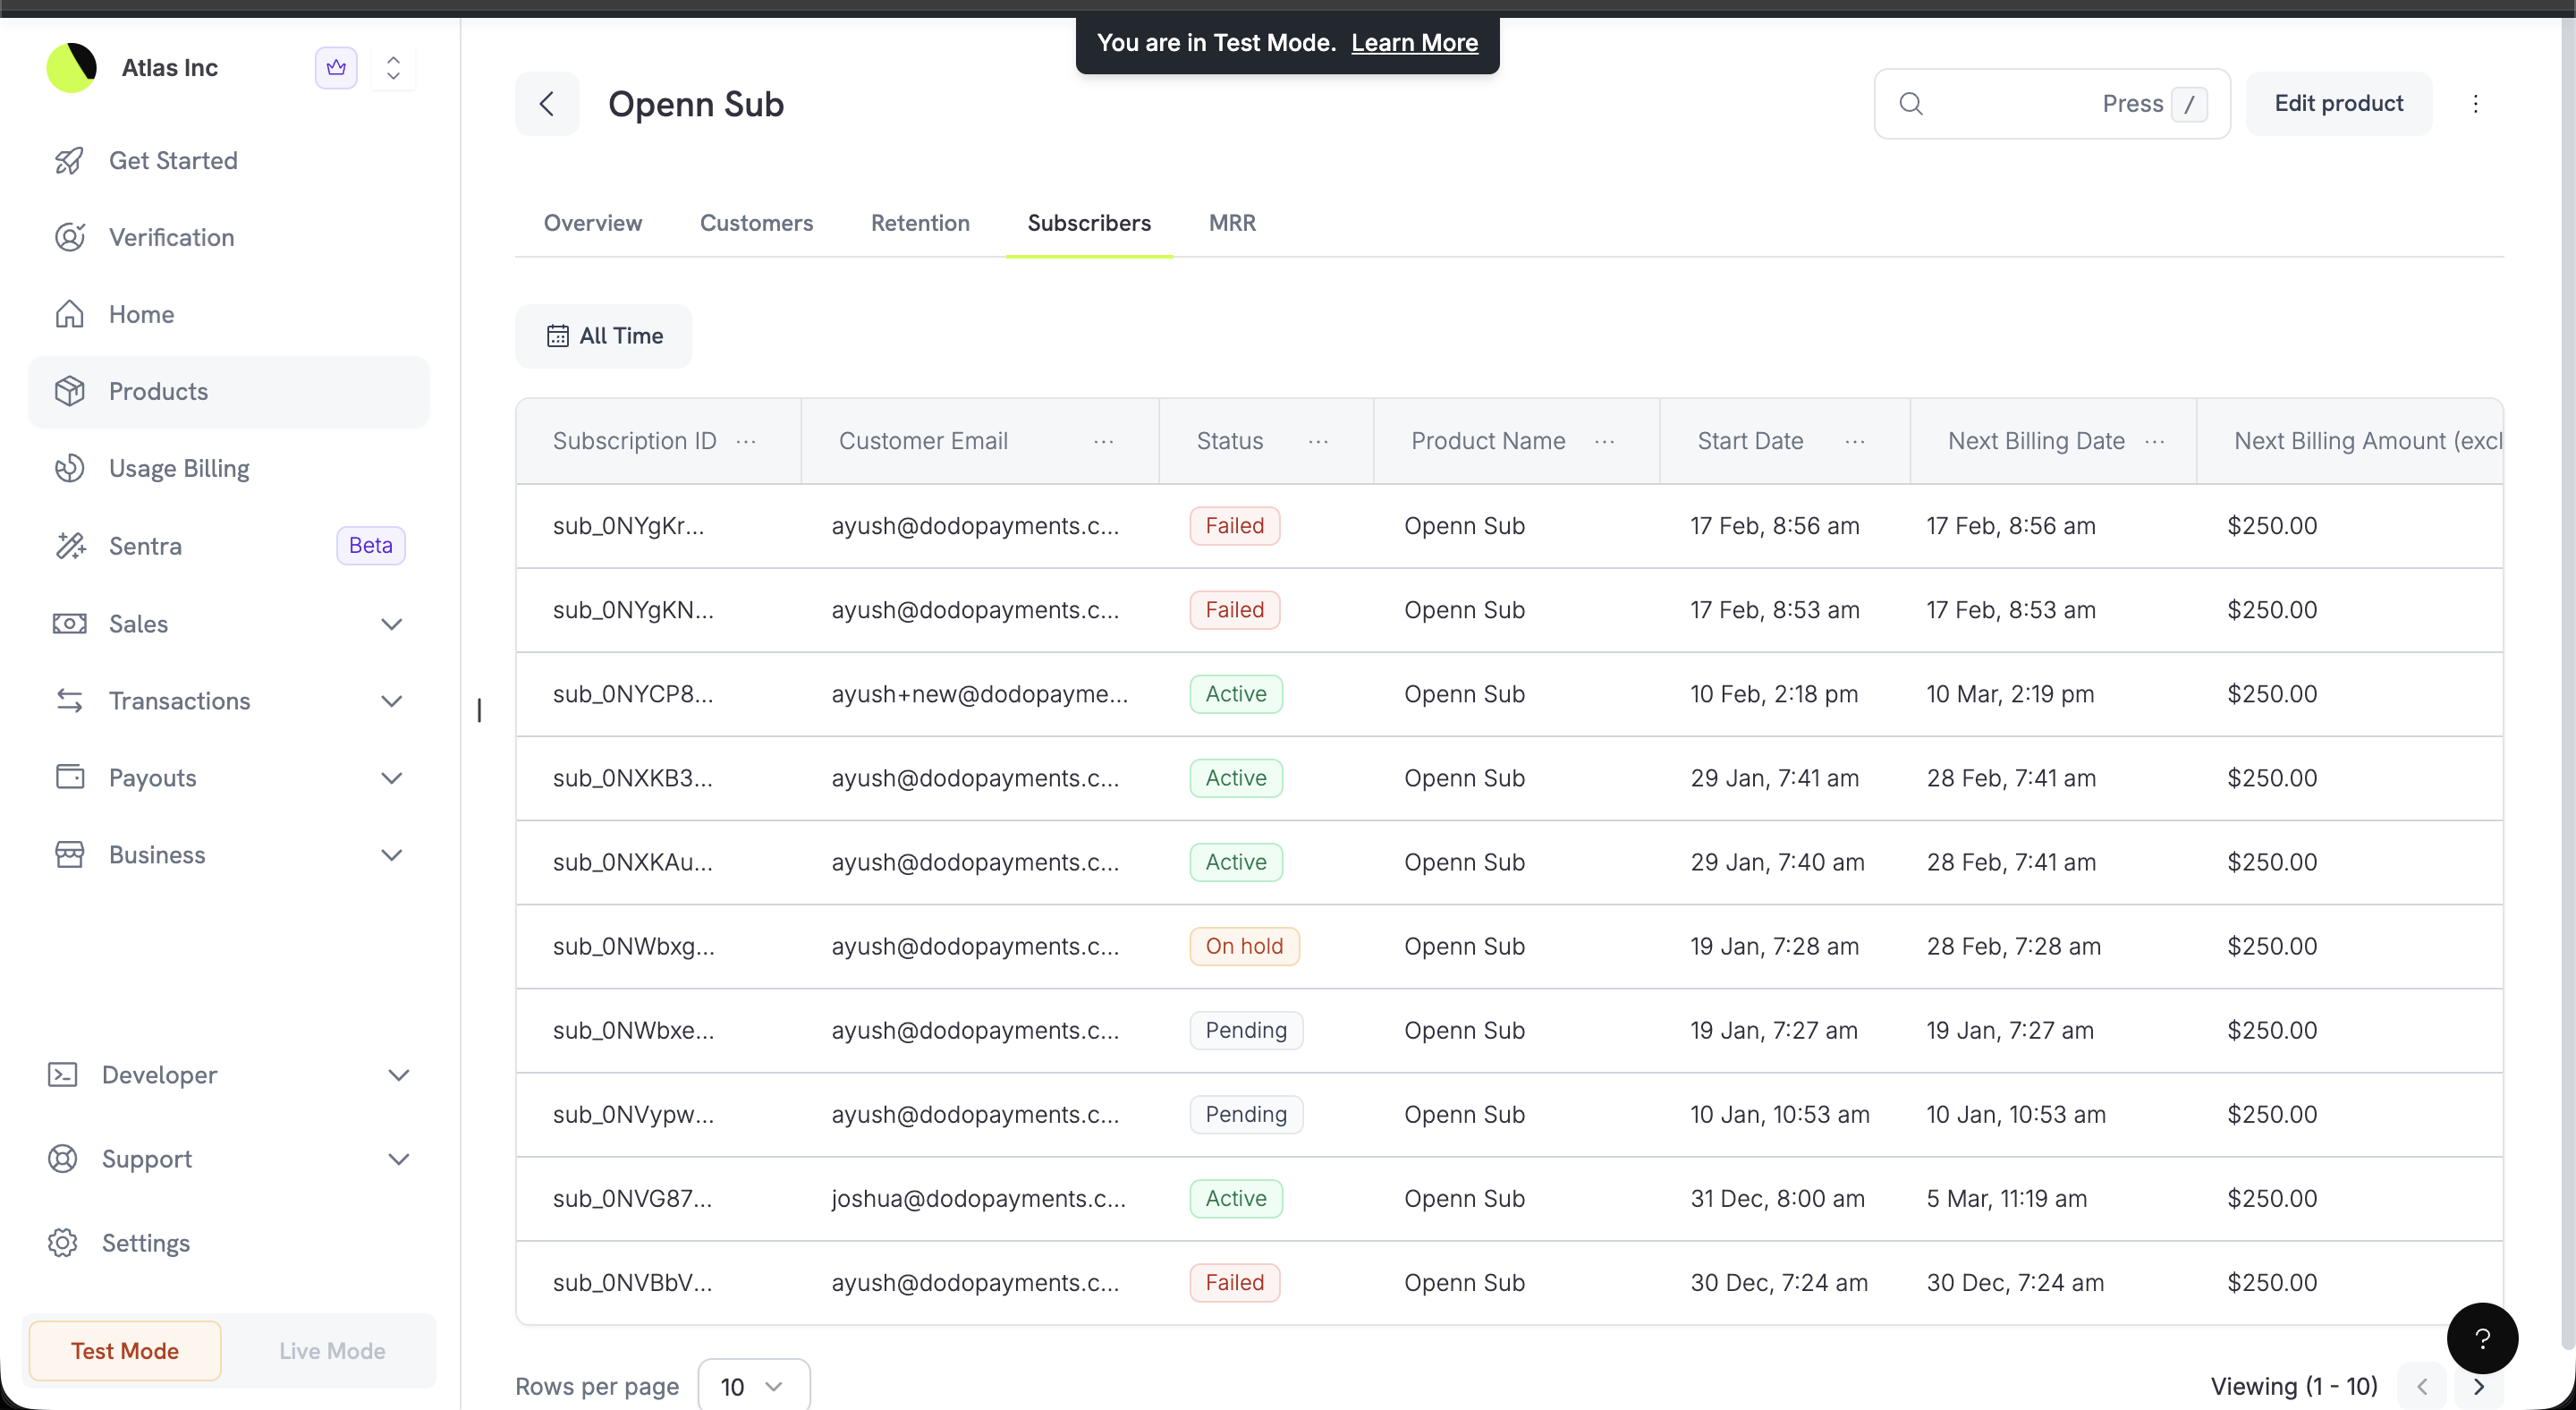
Subscribers tab with subscription IDs, customer emails, statuses, start dates, and next billing information

Subscribers table showing all subscriptions with statuses and billing details

추가 column에는 customer name 및 business name, billing frequency, trial days, cancellation detail, tax detail 및 ID가 표시됩니다.

MRR Tab

product의 Monthly Recurring Revenue 분석입니다.
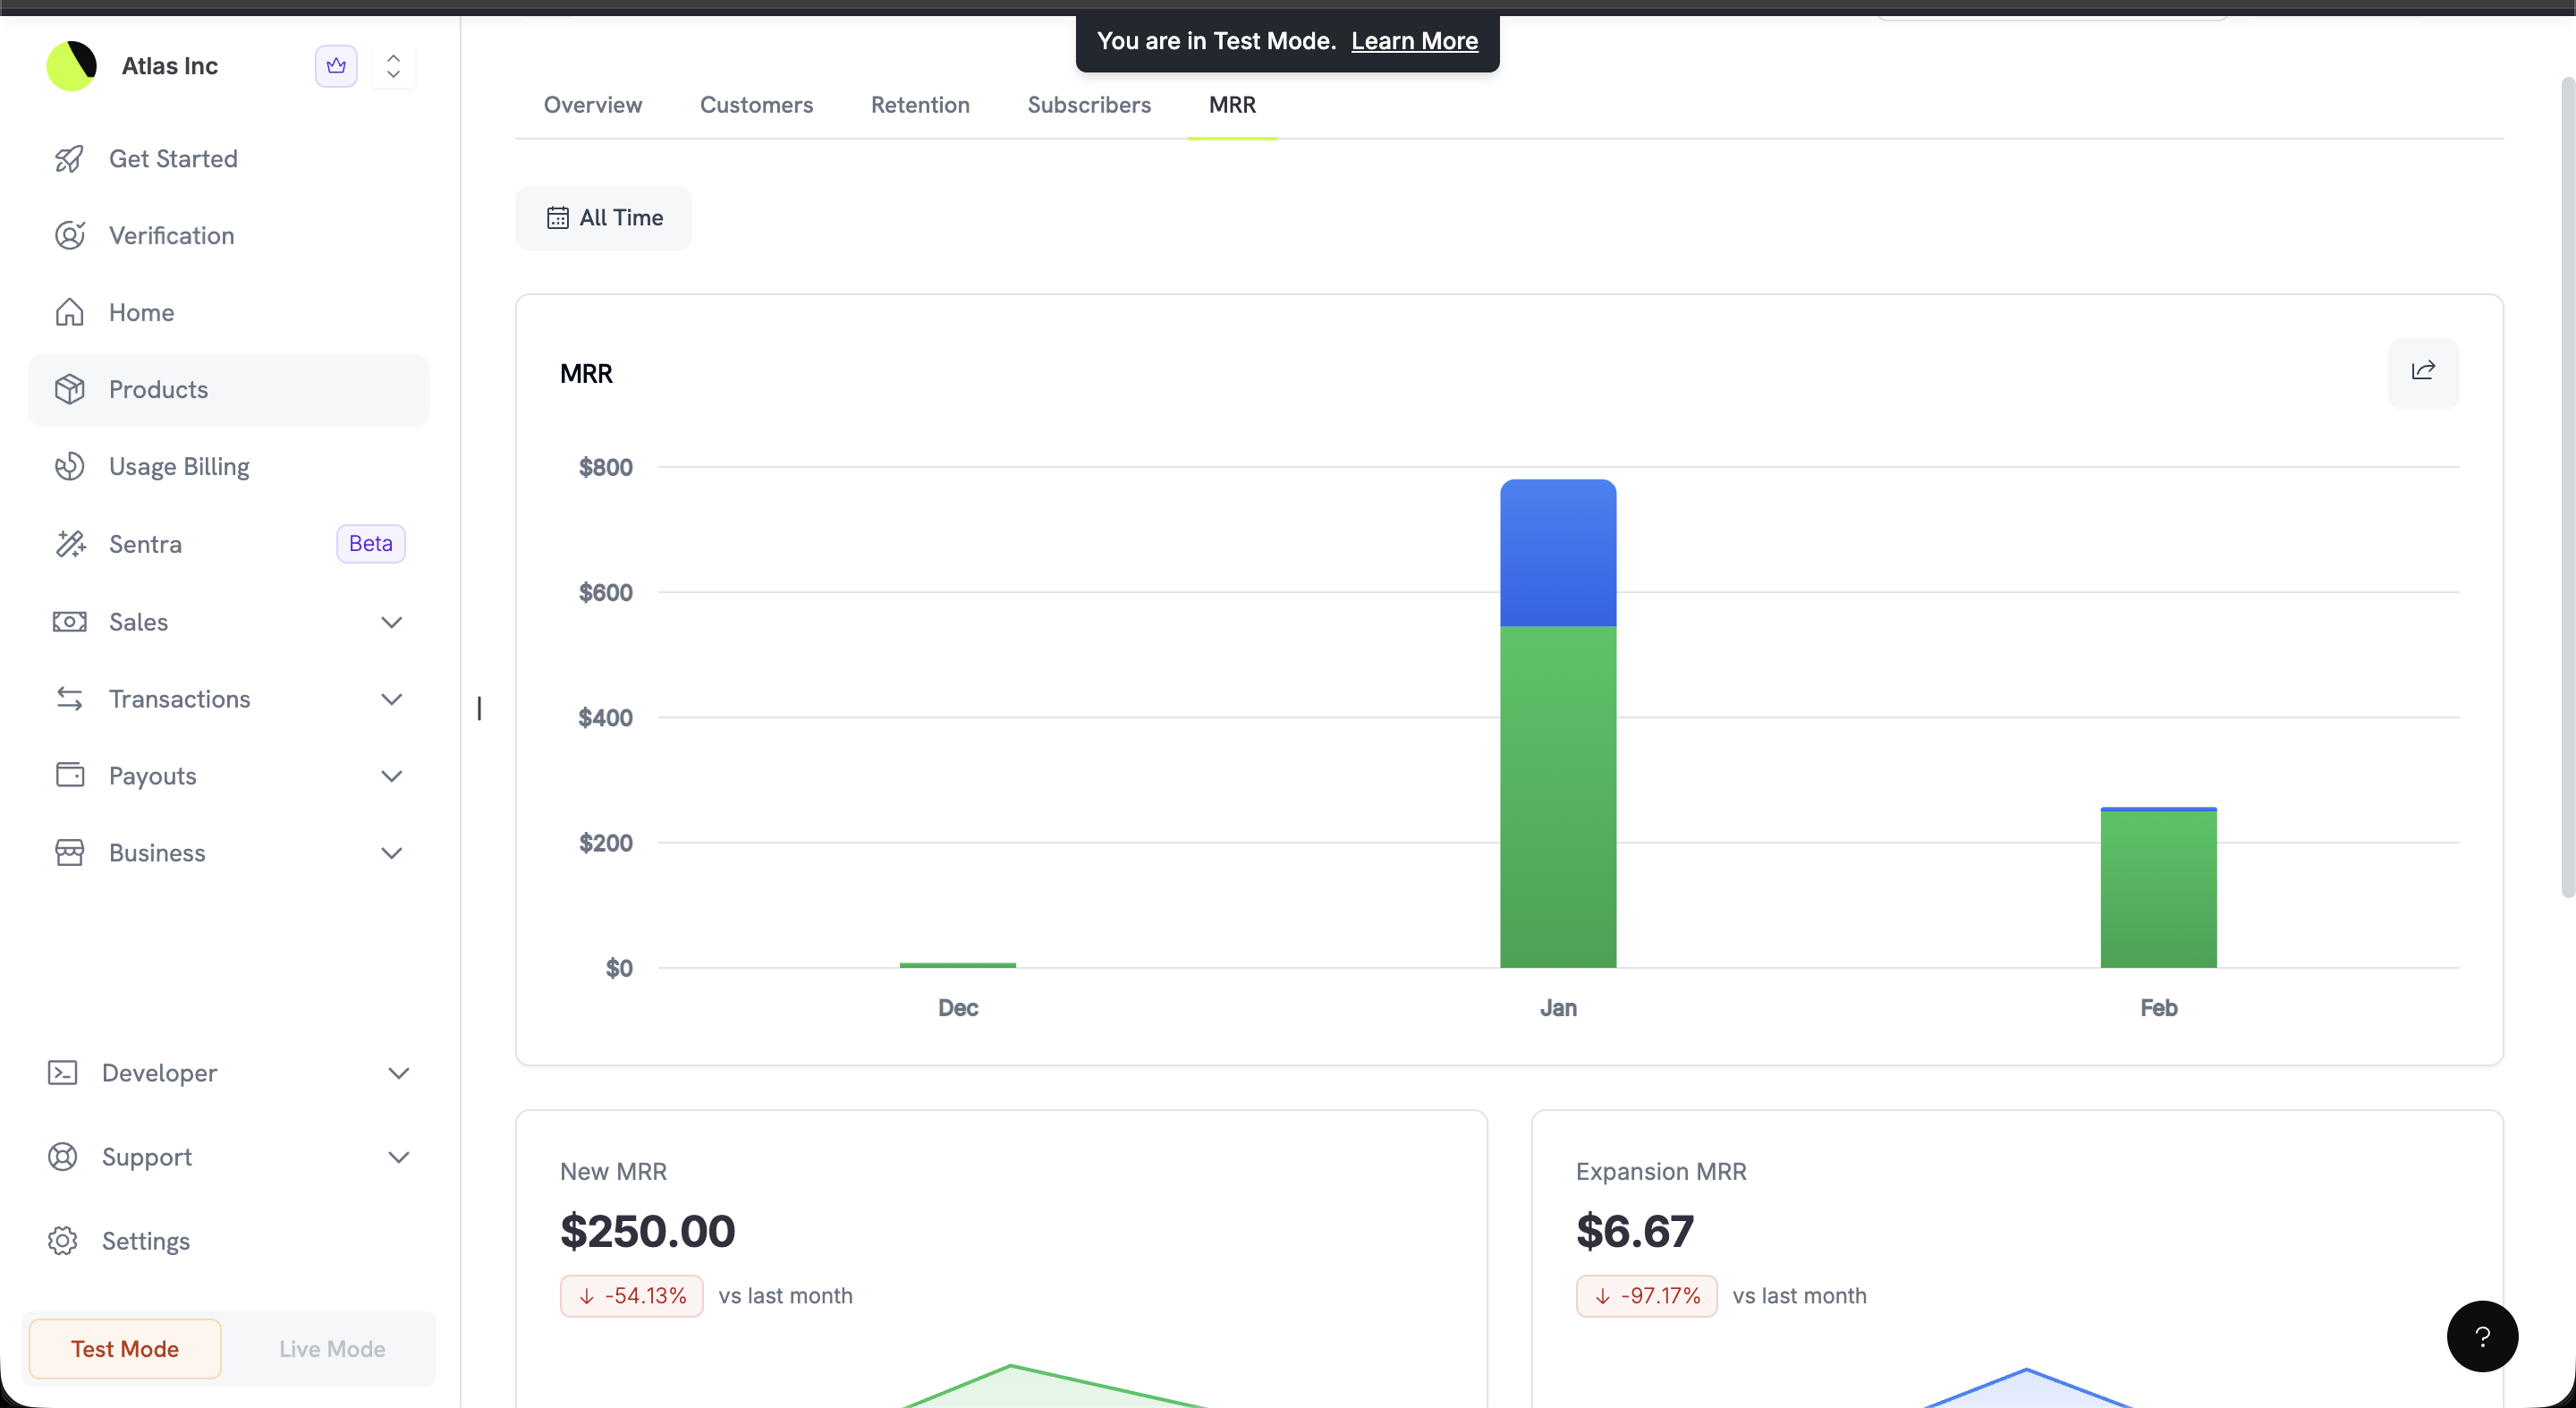
MRR tab with stacked bar chart showing new, expansion, and churned MRR by month

MRR stacked bar chart showing monthly revenue composition
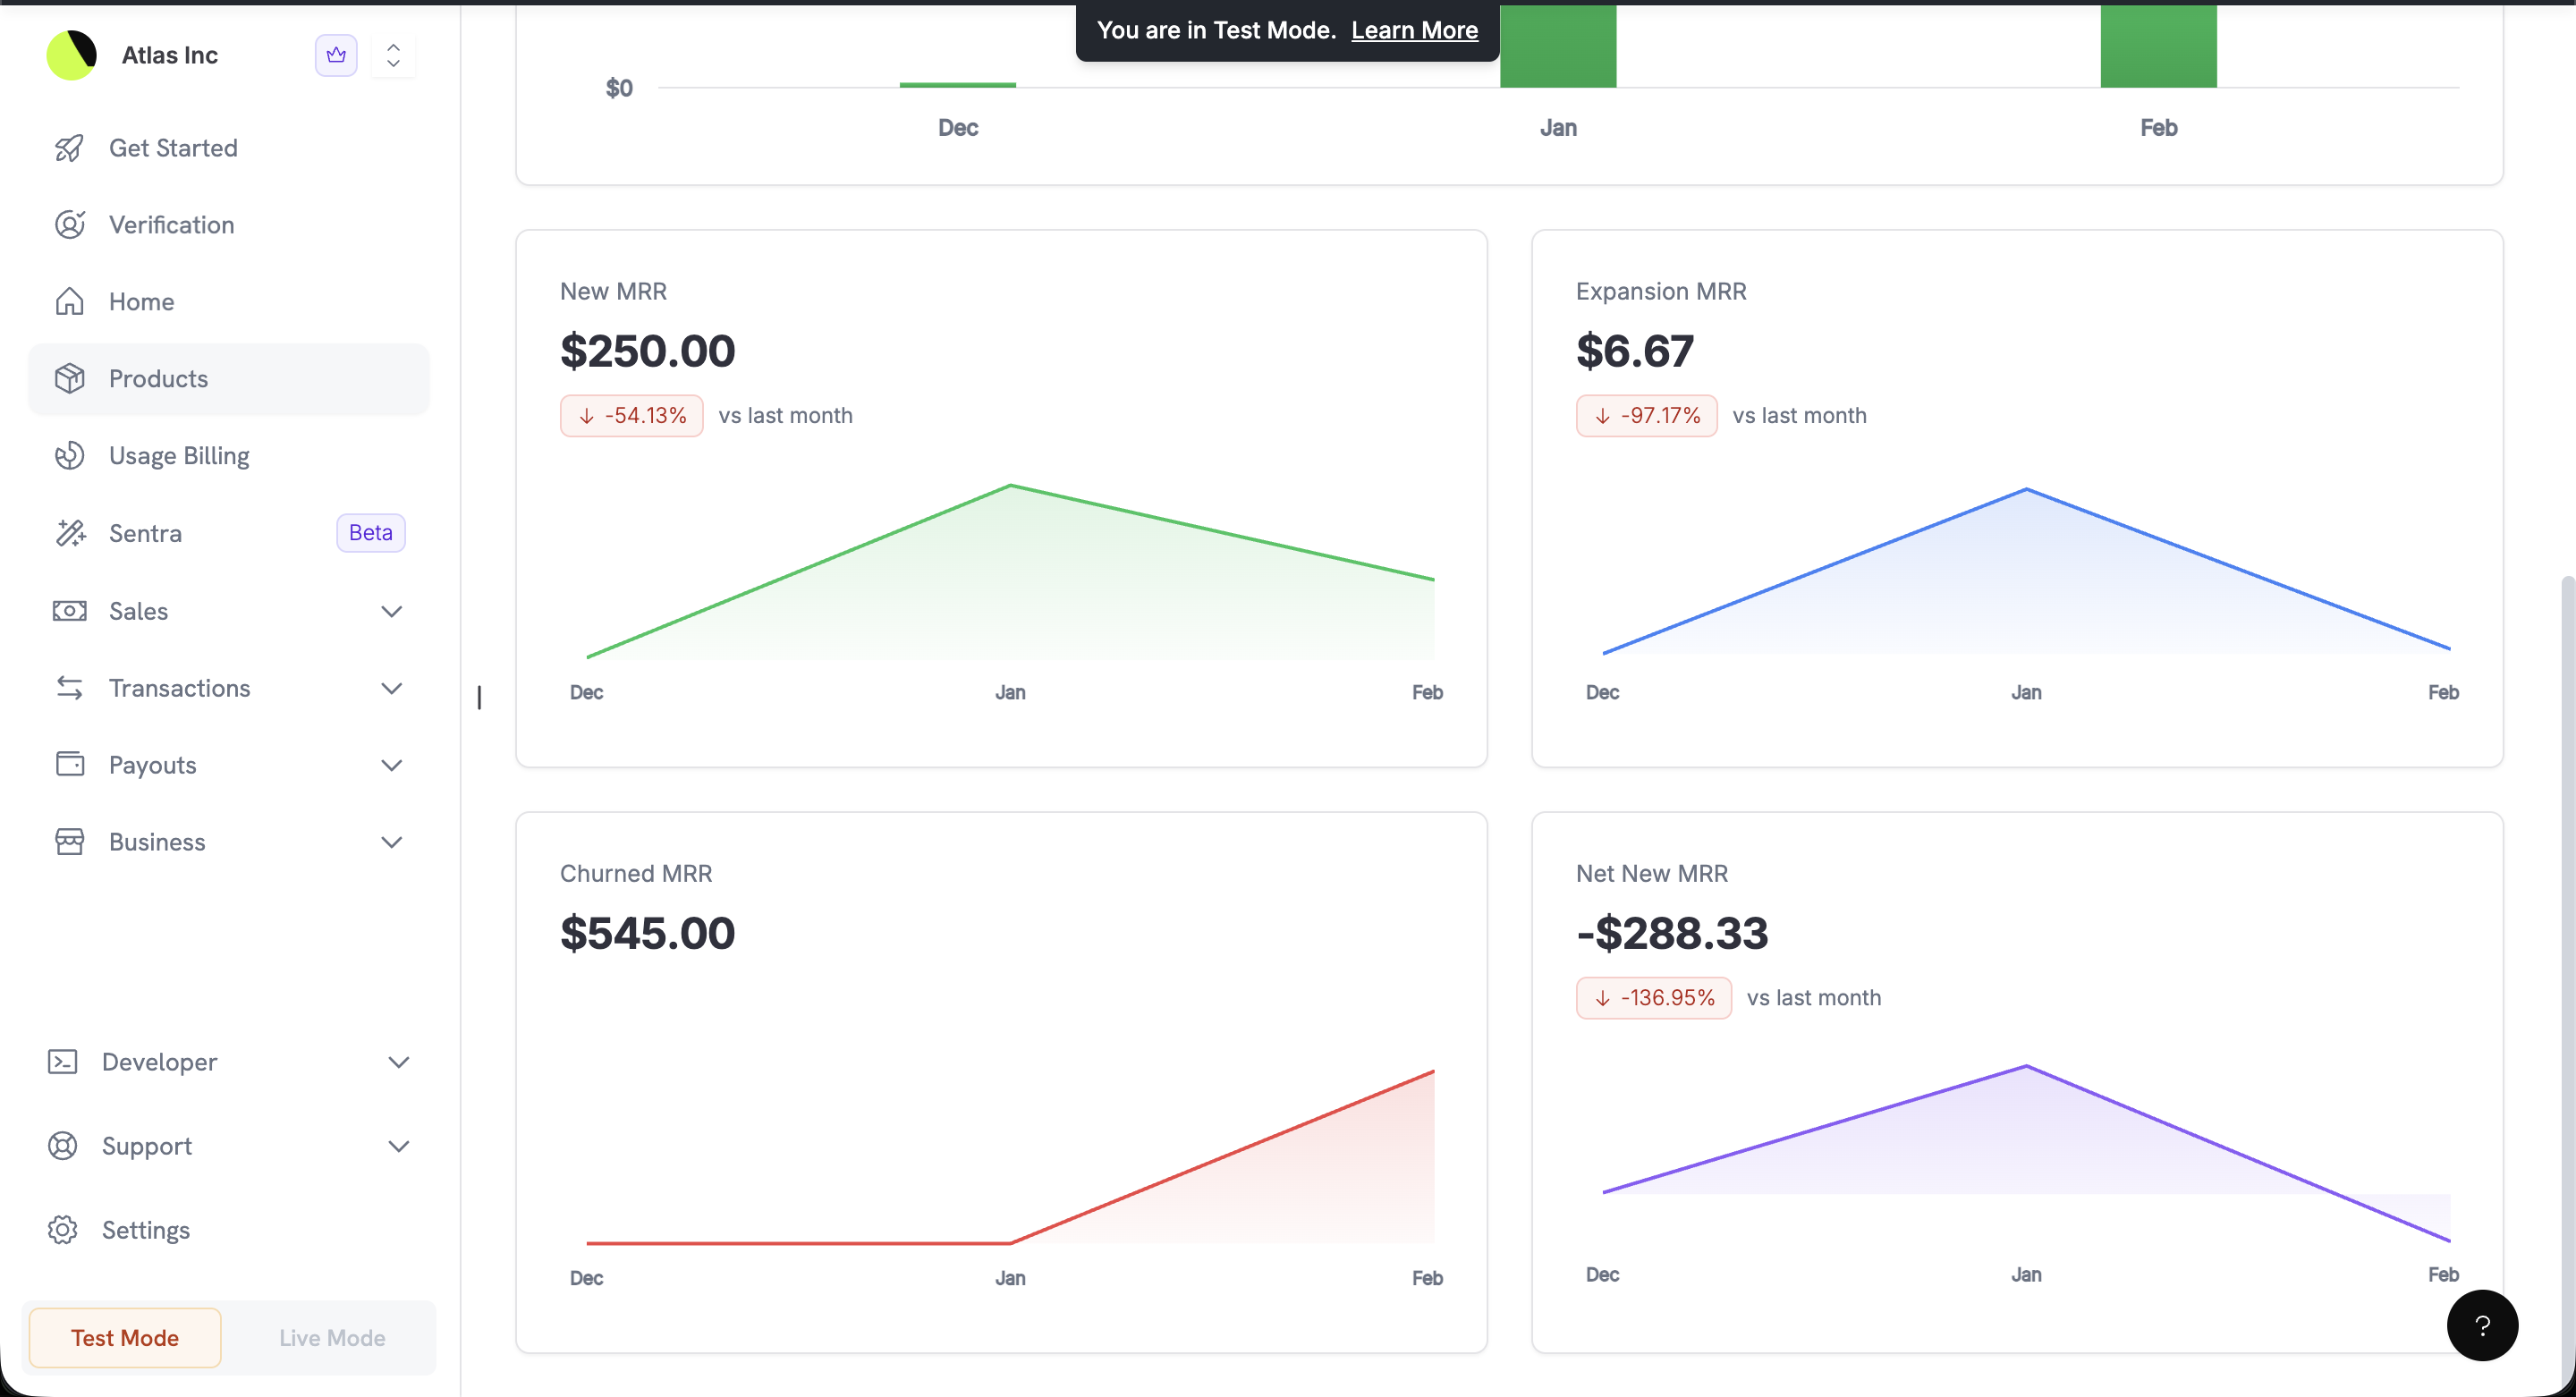
MRR tab에는 product의 subscription card인 Current MRR, Projected ARR, Net New MRR 및 Active Subscriptions와 함께 아래에 MRR 구성 요소가 표시됩니다.
MRR breakdown showing New MRR, Expansion MRR, Churned MRR, and Net New MRR with trend charts

Detailed MRR breakdown with New, Expansion, Churned, and Net New MRR

각 card는 filter bar에서 선택한 comparison period와 해당 값을 비교합니다.

Page Highlight Tiles

dashboard의 여러 목록 page 상단에는 highlight tiles가 표시되며, Analytics를 열지 않고도 summary metric을 확인할 수 있습니다. tile에는 page의 active filter가 적용됩니다.
“Active” product, add-on, collection 및 meter는 하나 이상의 successful payment에 포함된 항목을 의미합니다.

Reports

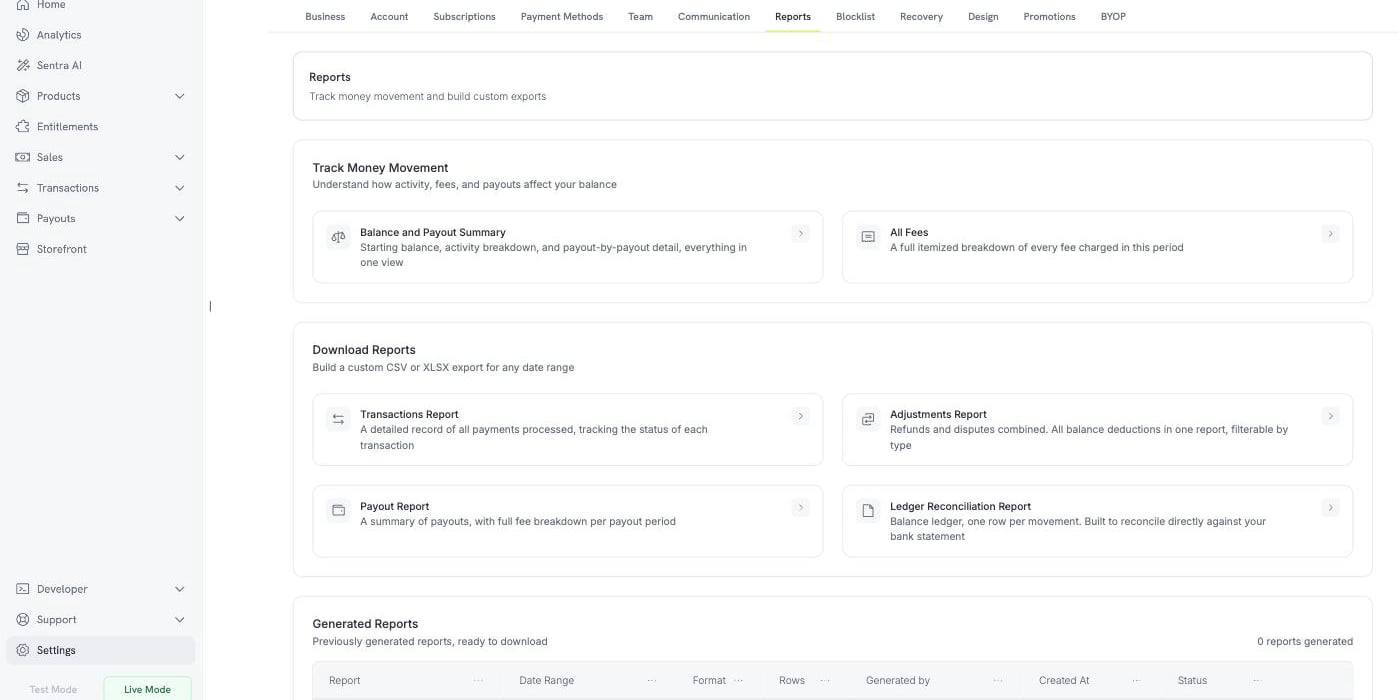
Reports에는 전용 page가 있습니다: Settings → Reports. 이곳에서 화면으로 money movement를 추적하고 모든 date range에 대해 CSV 또는 XLSX export를 생성할 수 있습니다. Reports는 live mode만 지원합니다.

Reports

Balance and Payout Summary, All Fees 및 4개의 downloadable report가 filter, row limit 및 전체 report history와 함께 제공됩니다.
두 가지 view에서 화면으로 balance와 fees를 확인할 수 있습니다. 네 가지 추가 view에서는 모든 date range에 대해 download를 생성할 수 있습니다.
The Reports tab in Settings, showing Track Money Movement, Download Reports, and Generated Reports

Settings → Reports: live views, custom exports, and your report history

Fees 전용 view가 있습니다. Settings → Reports에서 All Fees를 열어 total 및 transaction별 breakdown을 확인하세요.

Best Practices

  • analytics를 정기적으로 검토하여 추세와 이상 징후를 조기에 파악하세요.
  • filter를 사용하여 product와 기간별 performance를 비교하고, Revenue By Country를 사용하여 시장을 비교하세요.
  • product-level analytics를 열어 어떤 product가 가장 많은 revenue를 창출하며 어떤 product의 churn이 가장 높은지 확인하세요.
  • data가 잘못 표시되거나 누락된 경우 먼저 filter와 date range를 확인하세요.
filter를 확인한 후에도 불일치가 지속되거나 data가 여전히 누락된 경우 support에 문의하세요.

Contact Support

page, metric 및 date range를 포함하여 support@dodopayments.com으로 email을 보내세요.

Next Steps

Account Summary & Payout Wallet

earnings, deductions 및 payout cycle을 파악합니다.

Products

product를 생성하고 관리합니다.

Payments

모든 payment transaction을 추적하고 관리합니다.

Refunds

refund를 시작하고 모니터링합니다.
마지막 수정일 2026년 9월 26일