

API Reference — Events Ingestion
API Reference — Meters Creation
Creating a Meter
Meters define how your usage events are aggregated and measured for billing purposes. Before creating a meter, plan your usage tracking strategy:- Identify what usage events you want to track
- Determine how events should be aggregated (count, sum, etc.)
- Define any filtering requirements for specific use cases
Step-by-Step Meter Creation
Följ den här guiden för att konfigurera din användningsmätare:1
Configure Basic Information
Set up the fundamental details for your meter.
string
obligatorisk
Ett tydligt och beskrivande namn som identifierar vad den här mätaren spårar.Examples: “Tokens”, “API Calls”, “Storage Usage”, “Compute Hours”
string
En detaljerad förklaring av vad mätaren mäter.Example: “Counts each POST /v1/orders request made by the customer”
string
obligatorisk
Händelseidentifieraren som utlöser den här mätaren.Examples: “token”, “api.call”, “storage.usage”, “compute.session”
The event name must match exactly what you send in your usage events. Event names are case-sensitive.
2
Configure Aggregation Settings
Define how the meter calculates usage from your events.
string
obligatorisk
Select how events should be aggregated:
- Count
- Sum
- Max
- Last
Räknar antalet mottagna händelser.Use case: API calls, page views, file uploadsCalculation: Total number of events
string
The property name from event metadata to aggregate over.
string
obligatorisk
Enhetsetiketten som visas i rapporter och vid fakturering.Examples: “calls”, “GB”, “hours”, “tokens”
3
Configure Event Filtering (Optional)
Set up criteria to control which events are included in the meter.Enable Event FilteringToggle Enable Event Filtering to activate conditional event processing.Choose Filter LogicSelect how multiple conditions are evaluated:Setting Up Filter Conditions
Event filtering allows you to create sophisticated rules that determine which events contribute to your usage calculations. This is useful for excluding test events, filtering by user tiers, or focusing on specific actions.
- AND Logic
- OR Logic
All conditions must be true for an event to be counted. Use this when you need events to meet multiple strict criteria simultaneously.Example: Count API calls where
user_tier = "premium" AND endpoint = "/api/v2/users"1
Add Condition
Click Add condition to create a new filter rule.
2
Configure Property Key
Specify the property name from your event metadata.
3
Select Comparator
Välj bland tillgängliga operatorer:
equals— Exakt matchningnot_equals— Exkluderingsfiltergreater_than— Numerisk jämförelsegreater_than_or_equals— Numerisk jämförelse (inklusive)less_than— Numerisk jämförelseless_than_or_equals— Numerisk jämförelse (inklusive)contains— Sträng innehåller delsträngdoes_not_contain— Exkluderingsfilter för strängar
4
Set Comparison Value
Set the target value for comparison.
5
Add Groups
Use Add Group to create additional condition groups for complex logic.
4
Create Meter
Granska din mätarkonfiguration och klicka på Create Meter.
Din mätare är nu redo att ta emot och sammanställa användningshändelser.
Länka en mätare till en produkt
När du har skapat din mätare måste du länka den till en produkt för att aktivera förbrukningsbaserad fakturering. Den här processen kopplar mätarens användningsdata till prisregler för kundfakturering. När mätare länkas till produkter upprättas kopplingen mellan användningsspårning och fakturering:- Produkter definierar prisregler och faktureringsbeteende
- Mätare tillhandahåller användningsdata för faktureringsberäkningar
- Flera mätare kan länkas till en och samma produkt för komplexa faktureringsscenarier
Process för produktkonfiguration
Omvandla dina användningsdata till debiterbara avgifter genom att konfigurera produktinställningarna korrekt:1
Choose Usage-Based Billing Product Type
Gå till sidan för att skapa eller redigera produkten och välj Usage Based Billing som pristyp.
2
Select Associated Meter
Klicka på Associated Meters för att öppna panelen för val av mätare.I den här panelen kan du konfigurera vilka mätare som ska spåra användningen för produkten.
3
Add Your Meter
I panelen för val av mätare:
- Klicka på Add Meters för att visa tillgängliga mätare
- Välj mätaren du skapade i rullgardinsmenyn
- Den valda mätaren visas i produktkonfigurationen
4
Configure Price Per Unit
Ange priset för varje användningsenhet som mätaren spårar.
number
obligatorisk
Definiera hur mycket som ska debiteras för varje enhet som mäts av mätaren.Exempel: Om du anger $0.50 per enhet innebär det:
- 1 000 förbrukade enheter = 1 000 × $0.50 = $500.00 debiterat
- 500 förbrukade enheter = 500 × $0.50 = $250.00 debiterat
- 100 förbrukade enheter = 100 × $0.50 = $50.00 debiterat
5
Set Free Threshold (Optional)
Konfigurera en kostnadsfri användningskvot innan faktureringen börjar.
number
Antalet enheter som kunder kan förbruka utan kostnad innan beräkningen av betald användning börjar.Så fungerar det:
- Kostnadsfri gräns: 100 enheter
- Pris per enhet: $0.50
- Kundens användning: 250 enheter
- Beräkning: (250 - 100) × $0.50 = $75.00 debiterat
Kostnadsfria gränser passar bra för freemium-modeller, provperioder eller när du vill ge kunderna en grundläggande kvot som ingår i planen.
Den kostnadsfria gränsen gäller för varje faktureringsperiod och ger kunderna nya kvoter varje månad eller enligt ditt faktureringsschema.
6
Save Configuration
Granska din mätar- och priskonfiguration och klicka sedan på Save Changes för att slutföra konfigurationen.Vad händer härnäst:
Din produkt är nu konfigurerad för förbrukningsbaserad fakturering och debiterar automatiskt kunder baserat på deras uppmätta förbrukning.
- Användningshändelser som skickas till mätaren spåras och sammanställs
- Faktureringsberäkningar tillämpar automatiskt dina prisregler
- Kunder debiteras baserat på faktisk förbrukning under varje faktureringsperiod
Du kan lägga till upp till 50 mätare per produkt, vilket möjliggör avancerad användningsspårning över flera dimensioner, till exempel API-anrop, lagring, beräkningstid och anpassade mätvärden.
Skicka användningshändelser
När mätaren är konfigurerad kan du börja skicka användningshändelser från din applikation för att spåra kundernas användning.Händelsestruktur
Varje användningshändelse måste innehålla följande obligatoriska fält:string
obligatorisk
En unik identifierare för den specifika händelsen. Måste vara unik för alla händelser.
string
obligatorisk
Dodo Payments-kund-ID:t som användningen ska kopplas till.
string
obligatorisk
Händelsenamnet som matchar din mätarkonfiguration. Händelsenamn utlöser rätt mätare.
string
ISO 8601-tidsstämpel för när händelsen inträffade. Om den inte anges används den aktuella UTC-tidsstämpeln som standard. Måste ligga inom 1 timme bakåt och 5 minuter framåt — tidsstämplar utanför det intervallet avvisas.
object
Ytterligare egenskaper för filtrering och sammanställning. Inkludera alla värden som refereras i mätarens “Over Property” eller filtreringsvillkor.
Exempel på API för användningshändelser
Skicka användningshändelser till dina konfigurerade mätare med Events API:Viktigt att känna till för tillförlitlig mottagning
Följ dessa metoder för att hålla användningsspårningen korrekt och motståndskraftig i produktion.Ange tidsstämplar medvetet. Utelämna
timestamp för händelser i realtid så används den aktuella UTC-tidsstämpeln som standard. Ange den uttryckligen (ISO 8601) för fördröjda eller grupperade händelser så att användningen hamnar i rätt faktureringsperiod. Observera att det accepterade intervallet är snävt: händelser med tidsstämplar mer än 1 timme bakåt eller mer än 5 minuter framåt avvisas. Historisk återinläsning stöds inte — skicka buffrade händelser inom en timme.Analys av förbrukningsbaserad fakturering
Övervaka och analysera dina data för förbrukningsbaserad fakturering med en omfattande analyspanel. Spåra kundernas förbrukningsmönster, mätarprestanda och faktureringstrender för att optimera din prisstrategi och förstå användningsbeteenden.Översiktsanalys
Fliken Overview ger en omfattande bild av resultatet för din förbrukningsbaserade fakturering:Aktivitetsmått
Spåra viktig användningsstatistik över olika tidsperioder:metric
Visar användningsaktivitet för den aktuella faktureringsperioden och hjälper dig att förstå månatliga förbrukningsmönster.
metric
Visar kumulativ användningsstatistik sedan du började spåra användningen och ger insikter om långsiktig tillväxt.
Diagram över mätarvärden
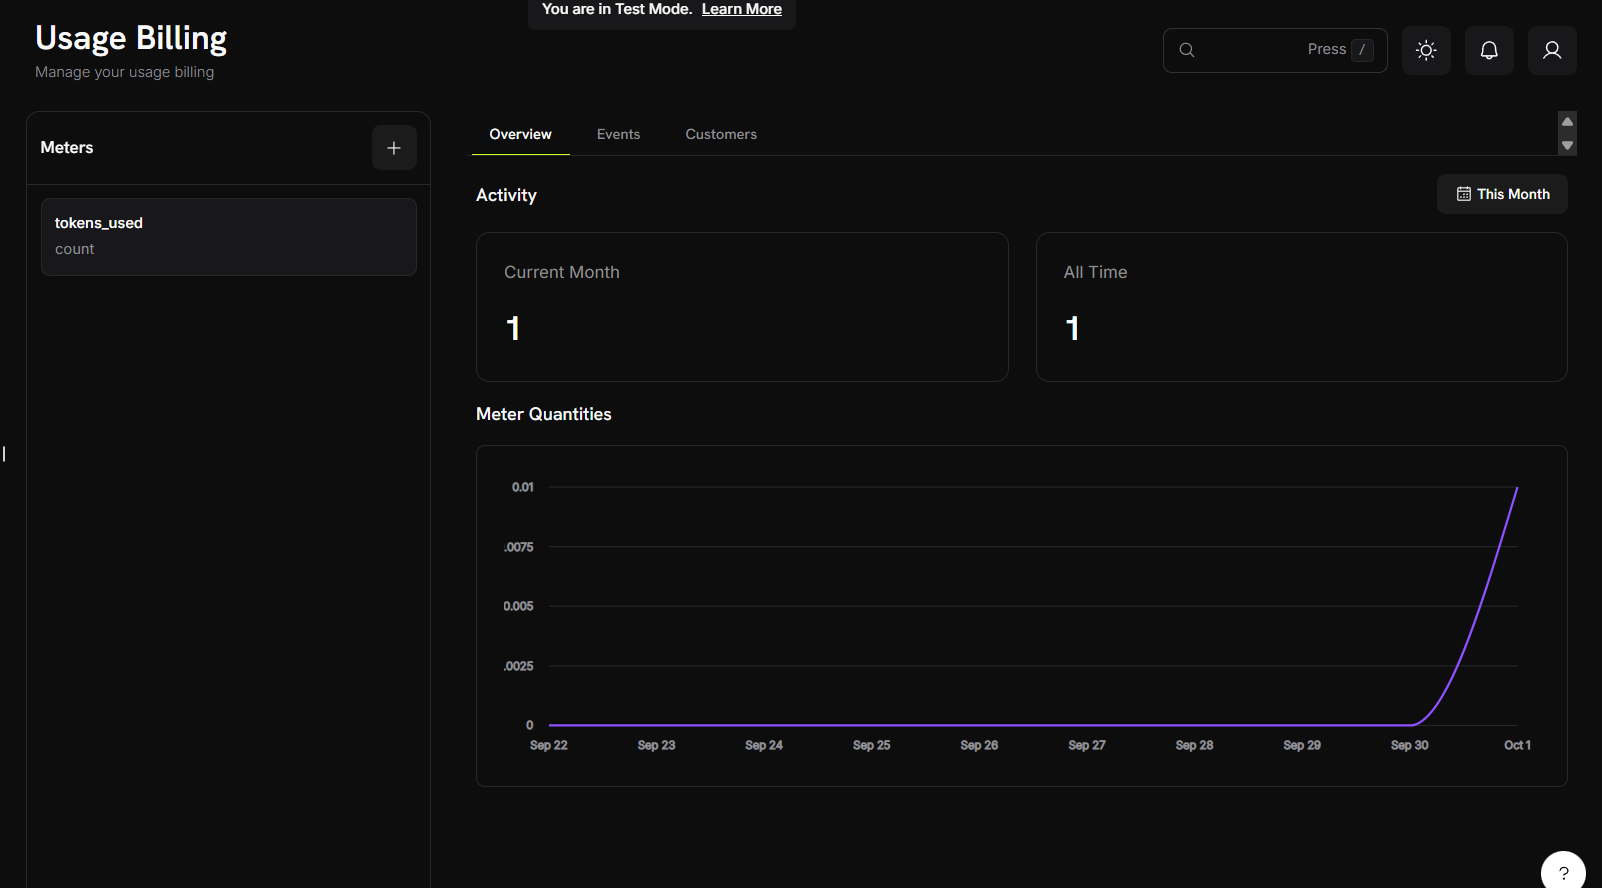
- Tidsserievisualisering: Spåra användningsmönster över dagar, veckor eller månader
- Stöd för flera mätare: Visa data från olika mätare samtidigt
- Trendanalys: Identifiera användningstoppar, mönster och tillväxtbanor
Diagrammet skalas automatiskt baserat på din användningsvolym och valda tidsintervall, vilket ger tydlig insyn i både små variationer och stora användningsförändringar.
Händelseanalys
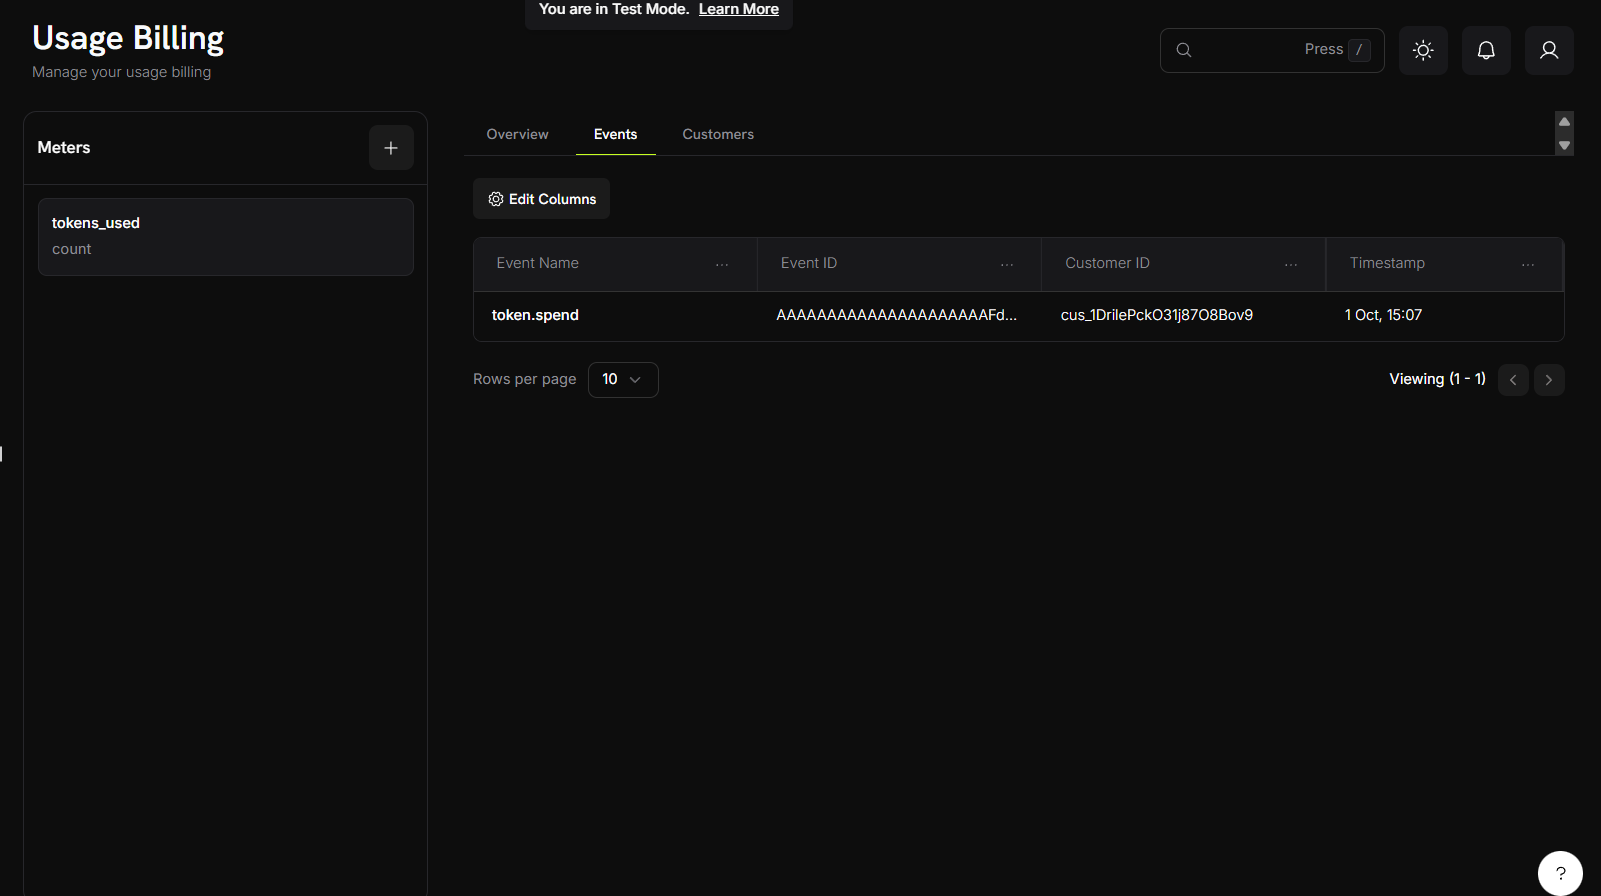
Visning av händelseinformation
Händelsetabellen ger en tydlig bild av enskilda användningshändelser med följande kolumner:- Event Name: Den specifika åtgärd eller utlösare som genererade användningshändelsen
- Event ID: En unik identifierare för varje händelseinstans
- Customer ID: Kunden som är kopplad till händelsen
- Timestamp: När händelsen inträffade
Den här vyn låter dig spåra och övervaka enskilda användningshändelser bland hela kundbasen och ger insyn i faktureringsberäkningar och användningsmönster.
Kundanalys
Fliken Customers visar en detaljerad tabellvy över kundernas användningsdata med följande information:Tillgängliga datakolumner
string
Kundens e-postadress för identifiering.
string
En unik identifierare för kundens prenumeration.
number
Antalet kostnadsfria enheter som ingår i kundens plan innan debitering tillämpas.
currency
Kostnaden per enhet för användning över den kostnadsfria gränsen.
timestamp
Tidsstämpeln för kundens senaste användningshändelse.
currency
Det totala belopp som debiterats kunden för förbrukningsbaserad fakturering.
number
Det totala antalet enheter som kunden har förbrukat.
number
Antalet enheter som överskrider den kostnadsfria gränsen och debiteras.
Tabellfunktioner
- Kolumnfiltrering: Använd funktionen “Edit Columns” för att visa eller dölja specifika datakolumner
- Uppdateringar i realtid: Användningsdata återspeglar de senaste förbrukningsmätvärdena
Exempel på sammanställning
Här är praktiska exempel på hur olika sammanställningstyper fungerar:Förstå sammanställningstyper
Olika sammanställningstyper passar olika faktureringsscenarier. Välj rätt typ utifrån hur du vill mäta och debitera användning.Praktiska implementeringsexempel
Dessa exempel visar verkliga tillämpningar av varje sammanställningstyp med exempel på händelser och förväntade resultat:Count Aggregation — API Calls
Count Aggregation — API Calls
Scenario: Spåra det totala antalet API-begärandenMätarkonfiguration:Resultat: 3 anrop faktureras kunden
- Händelsenamn:
api.call - Sammanställningstyp: Count
- Mätenhet:
calls
Sum Aggregation — Data Transfer
Sum Aggregation — Data Transfer
Scenario: Fakturera baserat på det totala antalet överförda byteMätarkonfiguration:Resultat: 1,5 GB total överföring faktureras kunden
- Händelsenamn:
data.transfer - Sammanställningstyp: Sum
- Over Property:
bytes - Mätenhet:
GB
Max Aggregation — Peak Concurrent Users
Max Aggregation — Peak Concurrent Users
Scenario: Fakturera baserat på det högsta antalet samtidiga användareMätarkonfiguration:Resultat: 23 samtidiga användare vid toppvärdet faktureras kunden
- Händelsenamn:
concurrent.users - Sammanställningstyp: Max
- Over Property:
count - Mätenhet:
users
Exempel på händelsefiltrering
- Filter by API Endpoint
- Filter by Value Range
- Complex Multi-Condition Filters
Räkna endast API-anrop till specifika endpoints:Filterkonfiguration:Resultat: Händelser som matchar filterkriterierna räknas. Händelser med andra endpoints ignoreras.
- Egenskap:
endpoint - Jämförelseoperator:
equals - Värde:
/v1/orders
Felsökning
Lös vanliga problem med implementering av förbrukningsbaserad fakturering och säkerställ korrekt spårning och fakturering.Vanliga problem
De flesta problem med förbrukningsbaserad fakturering hör till följande kategorier:- Problem med leverans och bearbetning av händelser
- Problem med mätarkonfiguration
- Fel i datatyper och formatering
- Problem med kund-ID och autentisering
Felsökningssteg
Vid felsökning av förbrukningsbaserad fakturering:- Verifiera händelseleveransen på fliken Events i analysvyn
- Kontrollera att mätarkonfigurationen överensstämmer med händelsestrukturen
- Validera kund-ID:n och API-autentisering
- Granska filtreringsvillkor och sammanställningsinställningar
Lösningar och korrigeringar
Events not showing in meter
Events not showing in meter
Vanliga orsaker:
- Händelsenamnet överensstämmer inte exakt med mätarkonfigurationen
- Händelsefiltreringsvillkor utesluter dina händelser
- Kund-ID:t finns inte i ditt Dodo Payments-konto
- Händelsens tidsstämpel ligger utanför den aktuella faktureringsperioden
- Kontrollera stavning och skiftlägeskänslighet för händelsenamnet
- Granska och testa filtreringsvillkoren
- Bekräfta att kund-ID:t är giltigt och aktivt
- Kontrollera att händelsetidsstämplarna är aktuella och korrekt formaterade
Aggregation not working as expected
Aggregation not working as expected
Vanliga orsaker:
- Namnet på Over Property matchar inte nycklarna i händelsemetadata
- Metadatavärdena har fel datatyp (sträng i stället för tal)
- Obligatoriska metadataegenskaper saknas
- Se till att metadatanycklarna exakt matchar inställningen för Over Property
- Konvertera strängar som innehåller tal till faktiska tal i dina händelser
- Inkludera alla obligatoriska egenskaper i varje händelse
Filtering not working
Filtering not working
Vanliga orsaker:
- Filteregenskapsnamnen matchar inte händelsemetadata
- Fel jämförelseoperator för datatypen (sträng i stället för tal)
- Skiftlägeskänslighet i strängjämförelser
- Kontrollera noggrant att egenskapsnamnen matchar exakt
- Använd lämpliga jämförelseoperatorer för dina datatyper
- Ta hänsyn till skiftlägeskänslighet när du filtrerar strängar