

API Reference — Events Ingestion
API Reference — Meters Creation
Creating a Meter
Meters define how your usage events are aggregated and measured for billing purposes. Before creating a meter, plan your usage tracking strategy:- Identify what usage events you want to track
- Determine how events should be aggregated (count, sum, etc.)
- Define any filtering requirements for specific use cases
Step-by-Step Meter Creation
Ikuti panduan ini untuk menyiapkan usage meter Anda:1
Configure Basic Information
Set up the fundamental details for your meter.
string
wajib
Nama yang jelas dan deskriptif untuk mengidentifikasi hal yang dilacak meter ini.Examples: “Tokens”, “API Calls”, “Storage Usage”, “Compute Hours”
string
Penjelasan terperinci tentang hal yang diukur meter ini.Example: “Counts each POST /v1/orders request made by the customer”
string
wajib
Event identifier yang akan memicu meter ini.Examples: “token”, “api.call”, “storage.usage”, “compute.session”
The event name must match exactly what you send in your usage events. Event names are case-sensitive.
2
Configure Aggregation Settings
Define how the meter calculates usage from your events.
string
wajib
Select how events should be aggregated:
- Count
- Sum
- Max
- Last
Menghitung jumlah event yang diterima.Use case: API calls, page views, file uploadsCalculation: Total number of events
string
The property name from event metadata to aggregate over.
string
wajib
Label unit untuk ditampilkan dalam laporan dan billing.Examples: “calls”, “GB”, “hours”, “tokens”
3
Configure Event Filtering (Optional)
Set up criteria to control which events are included in the meter.Enable Event FilteringToggle Enable Event Filtering to activate conditional event processing.Choose Filter LogicSelect how multiple conditions are evaluated:Setting Up Filter Conditions
Event filtering allows you to create sophisticated rules that determine which events contribute to your usage calculations. This is useful for excluding test events, filtering by user tiers, or focusing on specific actions.
- AND Logic
- OR Logic
All conditions must be true for an event to be counted. Use this when you need events to meet multiple strict criteria simultaneously.Example: Count API calls where
user_tier = "premium" AND endpoint = "/api/v2/users"1
Add Condition
Click Add condition to create a new filter rule.
2
Configure Property Key
Specify the property name from your event metadata.
3
Select Comparator
Pilih dari operator yang tersedia:
equals— Kecocokan tepatnot_equals— Filter pengecualiangreater_than— Perbandingan numerikgreater_than_or_equals— Perbandingan numerik (inklusif)less_than— Perbandingan numerikless_than_or_equals— Perbandingan numerik (inklusif)contains— String berisi substringdoes_not_contain— Filter pengecualian string
4
Set Comparison Value
Set the target value for comparison.
5
Add Groups
Use Add Group to create additional condition groups for complex logic.
4
Create Meter
Tinjau konfigurasi meter Anda lalu klik Create Meter.
Meter Anda kini siap menerima dan mengagregasi usage events.
Menghubungkan Meter ke Produk
Setelah membuat meter, Anda perlu menghubungkannya ke produk untuk mengaktifkan penagihan berbasis penggunaan. Proses ini menghubungkan data penggunaan meter dengan aturan harga untuk billing pelanggan. Menghubungkan meter ke produk menetapkan koneksi antara pelacakan penggunaan dan billing:- Produk menentukan aturan harga dan perilaku billing
- Meter menyediakan data penggunaan untuk perhitungan billing
- Beberapa meter dapat dihubungkan ke satu produk untuk skenario billing yang kompleks
Proses Konfigurasi Produk
Ubah data penggunaan Anda menjadi tagihan dengan mengonfigurasi pengaturan produk secara tepat:1
Choose Usage-Based Billing Product Type
Buka halaman pembuatan atau pengeditan produk, lalu pilih Usage Based Billing sebagai jenis harga.
2
Select Associated Meter
Klik Associated Meters untuk membuka panel pemilihan meter.Panel ini memungkinkan Anda mengonfigurasi meter yang akan melacak penggunaan untuk produk ini.
3
Add Your Meter
Di panel pemilihan meter:
- Klik Add Meters untuk melihat meter yang tersedia
- Pilih meter yang Anda buat dari daftar dropdown
- Meter yang dipilih akan muncul dalam konfigurasi produk Anda
4
Configure Price Per Unit
Tetapkan harga untuk setiap unit penggunaan yang dilacak meter Anda.
number
wajib
Tentukan jumlah biaya untuk setiap unit yang diukur meter Anda.Contoh: Menetapkan $0.50 per unit berarti:
- 1,000 unit digunakan = 1,000 × $0.50 = $500.00 dibebankan
- 500 unit digunakan = 500 × $0.50 = $250.00 dibebankan
- 100 unit digunakan = 100 × $0.50 = $50.00 dibebankan
5
Set Free Threshold (Optional)
Konfigurasikan kuota penggunaan gratis sebelum billing dimulai.
number
Jumlah unit yang dapat digunakan pelanggan tanpa biaya sebelum perhitungan penggunaan berbayar dimulai.Cara kerja:
- Ambang batas gratis: 100 unit
- Harga per unit: $0.50
- Penggunaan pelanggan: 250 unit
- Perhitungan: (250 - 100) × $0.50 = $75.00 dibebankan
Ambang batas gratis ideal untuk model freemium, periode uji coba, atau memberikan pelanggan kuota dasar yang termasuk dalam paket mereka.
Ambang batas gratis berlaku pada setiap siklus billing, sehingga pelanggan mendapatkan kuota baru setiap bulan atau sesuai jadwal billing Anda.
6
Save Configuration
Tinjau konfigurasi meter dan harga Anda, lalu klik Save Changes untuk menyelesaikan penyiapan.Yang terjadi selanjutnya:
Produk Anda kini dikonfigurasi untuk penagihan berbasis penggunaan dan akan secara otomatis membebankan biaya kepada pelanggan berdasarkan konsumsi yang diukur.
- Usage events yang dikirim ke meter akan dilacak dan diagregasi
- Perhitungan billing akan menerapkan aturan harga Anda secara otomatis
- Pelanggan akan dikenai biaya berdasarkan konsumsi aktual selama setiap siklus billing
Anda dapat menambahkan hingga 50 meter per produk, sehingga pelacakan penggunaan yang canggih dapat dilakukan pada berbagai dimensi seperti panggilan API, penyimpanan, waktu komputasi, dan metrik kustom.
Mengirim Usage Events
Setelah meter dikonfigurasi, Anda dapat mulai mengirim usage events dari aplikasi untuk melacak penggunaan pelanggan.Struktur Event
Setiap usage event harus menyertakan field wajib berikut:string
wajib
Identifier unik untuk event tertentu ini. Harus unik di antara semua event.
string
wajib
ID pelanggan Dodo Payments yang menjadi tujuan atribusi penggunaan ini.
string
wajib
Nama event yang cocok dengan konfigurasi meter Anda. Nama event memicu meter yang sesuai.
string
Timestamp ISO 8601 saat event terjadi. Jika tidak diberikan, default-nya adalah timestamp UTC saat ini. Harus berada dalam rentang 1 jam ke belakang dan 5 menit ke depan — timestamp di luar rentang tersebut akan ditolak.
object
Properti tambahan untuk filtering dan agregasi. Sertakan nilai apa pun yang direferensikan dalam kondisi “Over Property” atau filtering meter Anda.
Contoh API Usage Events
Kirim usage events ke meter yang telah dikonfigurasi menggunakan Events API:Hal Penting untuk Ingestion yang Andal
Ikuti praktik berikut agar pelacakan penggunaan tetap akurat dan tangguh di production.Tetapkan timestamp dengan sengaja. Abaikan
timestamp untuk event real-time dan default-nya akan menggunakan timestamp UTC saat ini. Tetapkan secara eksplisit dalam format ISO 8601 untuk event tertunda atau batch agar penggunaan masuk ke periode billing yang tepat. Perhatikan bahwa rentang yang diterima sempit: event dengan timestamp lebih dari 1 jam ke belakang atau lebih dari 5 menit ke depan akan ditolak. Backfill historis tidak didukung — kirim event yang disimpan dalam buffer dalam waktu satu jam.Analytics Penagihan Berbasis Penggunaan
Pantau dan analisis data penagihan berbasis penggunaan Anda dengan dashboard analytics yang komprehensif. Lacak pola konsumsi pelanggan, performa meter, dan tren billing untuk mengoptimalkan strategi harga serta memahami perilaku penggunaan.Analytics Ringkasan
Tab Overview memberikan tampilan komprehensif tentang performa penagihan berbasis penggunaan Anda:Metrik Aktivitas
Lacak statistik penggunaan utama pada berbagai periode waktu:metric
Menampilkan aktivitas penggunaan untuk periode billing saat ini, sehingga Anda dapat memahami pola konsumsi bulanan.
metric
Menampilkan statistik penggunaan kumulatif sejak Anda mulai melacaknya, sehingga memberikan insight pertumbuhan jangka panjang.
Grafik Kuantitas Meter
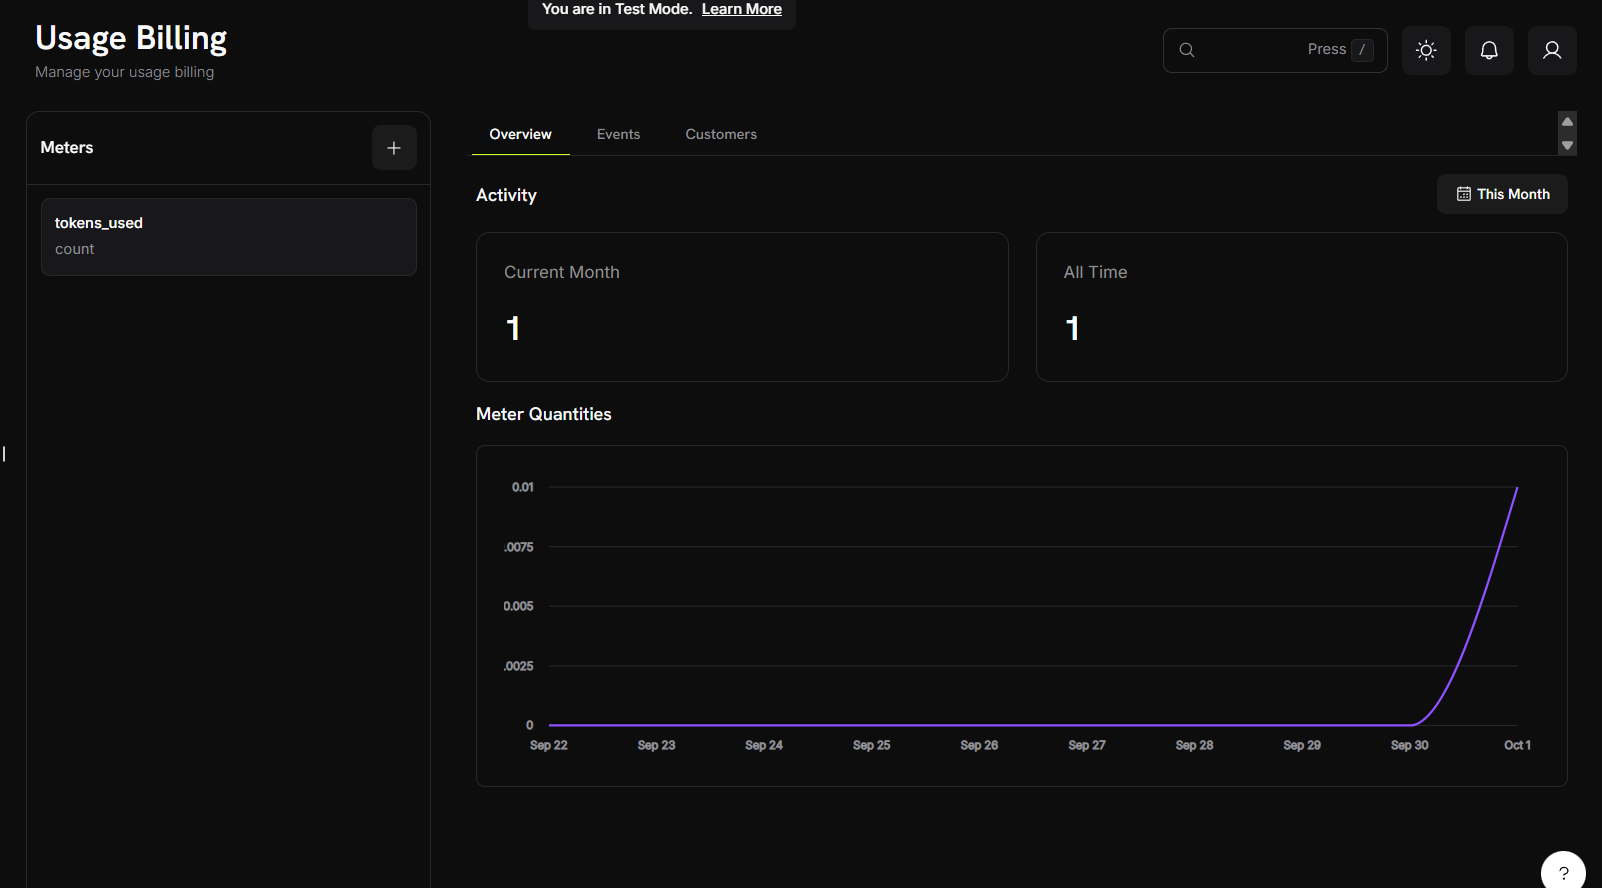
- Visualisasi deret waktu: Lacak pola penggunaan berdasarkan hari, minggu, atau bulan
- Dukungan beberapa meter: Lihat data dari berbagai meter secara bersamaan
- Analisis tren: Identifikasi lonjakan penggunaan, pola, dan trajektori pertumbuhan
Grafik secara otomatis menyesuaikan skala berdasarkan volume penggunaan dan rentang waktu yang dipilih, sehingga memberikan visibilitas yang jelas terhadap fluktuasi kecil maupun perubahan penggunaan besar.
Analytics Event
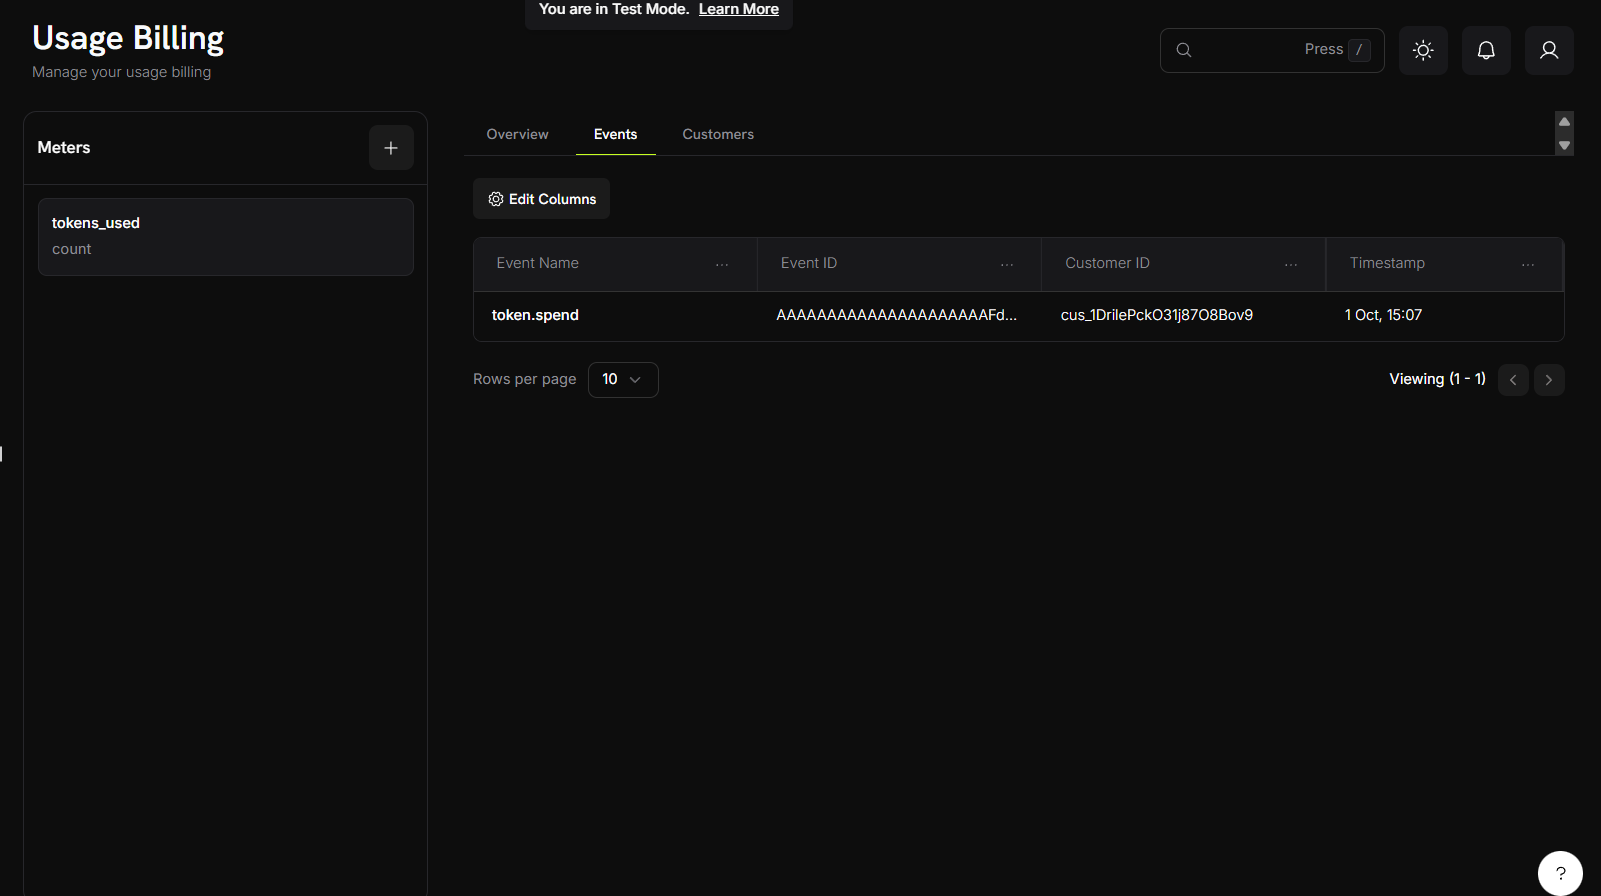
Tampilan Informasi Event
Tabel event memberikan tampilan yang jelas tentang setiap usage event dengan kolom berikut:- Nama Event: Tindakan atau pemicu tertentu yang menghasilkan usage event
- Event ID: Identifier unik untuk setiap instance event
- Customer ID: Pelanggan yang terkait dengan event
- Timestamp: Waktu saat event terjadi
Tampilan ini memungkinkan Anda melacak dan memantau setiap usage event di seluruh basis pelanggan, sehingga memberikan transparansi terhadap perhitungan billing dan pola penggunaan.
Analytics Pelanggan
Tab Customers menyediakan tampilan tabel terperinci tentang data penggunaan pelanggan dengan informasi berikut:Kolom Data yang Tersedia
string
Alamat email pelanggan untuk identifikasi.
string
Identifier unik untuk subscription pelanggan.
number
Jumlah unit gratis yang termasuk dalam paket pelanggan sebelum biaya berlaku.
currency
Biaya per unit untuk penggunaan yang melebihi ambang batas gratis.
timestamp
Timestamp usage event terbaru pelanggan.
currency
Total jumlah yang dibebankan kepada pelanggan untuk penagihan berbasis penggunaan.
number
Total jumlah unit yang telah digunakan pelanggan.
number
Jumlah unit yang melebihi ambang batas gratis dan dikenai biaya.
Fitur Tabel
- Filtering Kolom: Gunakan fitur “Edit Columns” untuk menampilkan atau menyembunyikan kolom data tertentu
- Pembaruan Real-time: Data penggunaan mencerminkan metrik konsumsi terbaru
Contoh Agregasi
Berikut contoh praktis cara kerja berbagai jenis agregasi:Memahami Jenis Agregasi
Berbagai jenis agregasi digunakan untuk skenario billing yang berbeda. Pilih jenis yang tepat berdasarkan cara Anda ingin mengukur dan membebankan biaya penggunaan.Contoh Implementasi Praktis
Contoh-contoh ini menunjukkan penerapan nyata setiap jenis agregasi dengan sample event dan hasil yang diharapkan:Count Aggregation — API Calls
Count Aggregation — API Calls
Skenario: Melacak jumlah total permintaan APIKonfigurasi Meter:Hasil: 3 panggilan ditagihkan kepada pelanggan
- Nama Event:
api.call - Jenis Agregasi: Count
- Unit Pengukuran:
calls
Sum Aggregation — Data Transfer
Sum Aggregation — Data Transfer
Skenario: Menagih berdasarkan total byte yang ditransferKonfigurasi Meter:Hasil: total transfer 1.5 GB ditagihkan kepada pelanggan
- Nama Event:
data.transfer - Jenis Agregasi: Sum
- Over Property:
bytes - Unit Pengukuran:
GB
Max Aggregation — Peak Concurrent Users
Max Aggregation — Peak Concurrent Users
Skenario: Menagih berdasarkan jumlah pengguna bersamaan tertinggiKonfigurasi Meter:Hasil: 23 pengguna bersamaan pada puncak ditagihkan kepada pelanggan
- Nama Event:
concurrent.users - Jenis Agregasi: Max
- Over Property:
count - Unit Pengukuran:
users
Contoh Filtering Event
- Filter by API Endpoint
- Filter by Value Range
- Complex Multi-Condition Filters
Hanya menghitung panggilan API ke endpoint tertentu:Konfigurasi Filter:Hasil: Event yang sesuai dengan kriteria filter akan dihitung. Event dengan endpoint berbeda akan diabaikan.
- Properti:
endpoint - Comparator:
equals - Nilai:
/v1/orders
Pemecahan Masalah
Atasi masalah umum dalam implementasi penagihan berbasis penggunaan dan pastikan pelacakan serta billing akurat.Masalah Umum
Sebagian besar masalah penagihan berbasis penggunaan termasuk dalam kategori berikut:- Masalah pengiriman dan pemrosesan event
- Masalah konfigurasi meter
- Error tipe dan format data
- Masalah Customer ID dan autentikasi
Langkah Debugging
Saat melakukan troubleshooting penagihan berbasis penggunaan:- Verifikasi pengiriman event di tab analytics Events
- Pastikan konfigurasi meter sesuai dengan struktur event
- Validasi Customer ID dan autentikasi API
- Tinjau kondisi filtering dan pengaturan agregasi
Solusi dan Perbaikan
Events not showing in meter
Events not showing in meter
Penyebab umum:
- Nama event tidak sama persis dengan konfigurasi meter
- Kondisi filtering event mengecualikan event Anda
- Customer ID tidak ada di akun Dodo Payments Anda
- Timestamp event berada di luar periode billing saat ini
- Verifikasi ejaan nama event dan sensitivitas huruf besar-kecil
- Tinjau dan uji kondisi filtering Anda
- Pastikan Customer ID valid dan aktif
- Pastikan timestamp event masih baru dan diformat dengan benar
Aggregation not working as expected
Aggregation not working as expected
Penyebab umum:
- Nama Over Property tidak cocok dengan key metadata event
- Nilai metadata memiliki tipe data yang salah (string vs number)
- Properti metadata wajib tidak ada
- Pastikan key metadata sama persis dengan pengaturan Over Property
- Ubah angka string menjadi angka aktual dalam event Anda
- Sertakan semua properti wajib di setiap event
Filtering not working
Filtering not working
Penyebab umum:
- Nama properti filter tidak cocok dengan metadata event
- Comparator salah untuk tipe data (string vs number)
- Sensitivitas huruf besar-kecil dalam perbandingan string
- Periksa kembali apakah nama properti benar-benar cocok
- Gunakan comparator yang sesuai untuk tipe data Anda
- Pertimbangkan sensitivitas huruf besar-kecil saat memfilter string