

API Reference — Events Ingestion
API Reference — Meters Creation
创建计量器
计量器定义了您的使用事件如何被聚合和测量以用于计费。 在创建计量器之前,请规划您的使用跟踪策略:- 确定您想跟踪哪些使用事件
- 决定事件如何聚合(计数、求和等)
- 为特定用例定义任何过滤要求
逐步创建计量器
按照本指南设置 usage meter:1
2
3
Configure Event Filtering (Optional)
设置标准以控制哪些事件包含在计量器中。启用事件过滤切换 启用事件过滤 以激活条件事件处理。选择过滤逻辑选择如何评估多个条件:设置过滤条件
事件过滤允许您创建复杂规则,以确定哪些事件有助于您的使用计算。这对于排除测试事件,根据用户等级进行过滤或专注于特定操作非常有用。
- AND Logic
- OR Logic
所有条件必须为真才能计入事件。当您需要事件同时满足多个严格条件时使用此选项。示例: 计算 API 调用,其中
user_tier = "premium" AND endpoint = "/api/v2/users"1
Add Condition
点击 添加条件 来创建新过滤规则。
2
Configure Property Key
指定来自事件元数据的属性名称。
3
Select Comparator
从可用的 operators 中选择:
equals— 完全匹配not_equals— 排除过滤器greater_than— 数值比较greater_than_or_equals— 数值比较(包含边界)less_than— 数值比较less_than_or_equals— 数值比较(包含边界)contains— 字符串包含子字符串does_not_contain— 字符串排除过滤器
4
Set Comparison Value
设置比较的目标值。
5
Add Groups
使用 添加组 创建附加条件组,以实现复杂逻辑。
4
Create Meter
检查 meter 配置,然后点击 Create Meter。
你的 meter 现在已准备好接收和聚合 usage events。
在 Product 中关联 Meter
创建 meter 后,需要将其关联到 product,才能启用 usage-based billing。此过程会将 meter 的 usage data 连接到用于 customer billing 的 pricing rules。 将 meters 关联到 products 可建立 usage tracking 与 billing 之间的连接:- Products 定义 pricing rules 和 billing behavior
- Meters 提供用于 billing calculations 的 usage data
- 多个 meters 可以关联到单个 product,以支持复杂的 billing scenarios
Product 配置流程
通过正确配置 product settings,将 usage data 转换为可计费的 charges:1
Choose Usage-Based Billing Product Type
前往 product creation 或 editing 页面,并将 Usage Based Billing 选为 pricing type。
2
Select Associated Meter
点击 Associated Meters 打开 meter selection panel。此面板用于配置哪些 meters 将跟踪此 product 的 usage。
3
Add Your Meter
在 meter selection panel 中:
- 点击 Add Meters 查看可用 meters
- 从下拉列表中选择你创建的 meter
- 所选 meter 将显示在 product configuration 中
4
Configure Price Per Unit
设置 meter 所跟踪的每个 usage unit 的价格。
number
必填
定义 meter 测量的每个 unit 应收取的金额。示例:设置每 unit $0.50 意味着:
- 消耗 1,000 units = 1,000 × $0.50 = 收取 $500.00
- 消耗 500 units = 500 × $0.50 = 收取 $250.00
- 消耗 100 units = 100 × $0.50 = 收取 $50.00
5
Set Free Threshold (Optional)
在 billing 开始前配置免费 usage allowance。
number
客户可以免费消耗的 units 数量,超过该数量后才开始计算 paid usage。工作原理:
- Free threshold:100 units
- Price per unit:$0.50
- Customer usage:250 units
- Calculation:(250 - 100) × $0.50 = 收取 $75.00
Free thresholds 非常适合 freemium models、trial periods,或在 plan 中为客户提供包含的基础 allowance。
Free threshold 适用于每个 billing cycle,让客户每月或按照你的 billing schedule 获得新的 allowances。
6
Save Configuration
检查 meter 和 pricing configuration,然后点击 Save Changes 完成设置。接下来会发生什么:
你的 product 现在已配置为 usage-based billing,并会根据客户的 measured consumption 自动收取费用。
- 发送到 meter 的 usage events 将被跟踪和聚合
- Billing calculations 将自动应用你的 pricing rules
- 客户将在每个 billing cycle 中根据实际 consumption 收费
每个 product 最多可以添加 50 个 meters,从而支持跨多个维度进行复杂的 usage tracking,例如 API calls、storage、compute time 和 custom metrics。
发送 Usage Events
配置 meter 后,你可以开始从 application 发送 usage events,以跟踪客户 usage。Event Structure
每个 usage event 必须包含以下 required fields:string
必填
此特定 event 的唯一 identifier。必须在所有 events 中保持唯一。
string
必填
该 usage 应归属的 Dodo Payments customer ID。
string
必填
与 meter configuration 匹配的 event name。Event names 会触发相应的 meter。
string
Event 发生时的 ISO 8601 timestamp。如果未提供,则默认为当前 UTC timestamp。必须位于过去 1 小时至未来 5 分钟的范围内——超出该范围的 timestamps 将被拒绝。
object
用于 filtering 和 aggregation 的 additional properties。包含 meter 的 “Over Property” 或 filtering conditions 中引用的所有 values。
Usage Events API 示例
使用 Events API 将 usage events 发送到已配置的 meters:Reliable Ingestion 的关键事项
遵循以下实践,确保 production 中的 usage tracking 准确且可靠。有意识地设置 timestamps。 对于 real-time events,省略
timestamp,它会默认为当前 UTC timestamp。对于 delayed 或 batched events,应显式设置该字段(ISO 8601),使 usage 进入正确的 billing period。请注意,接受的时间窗口很窄:timestamp 早于过去 1 小时或晚于未来 5 分钟的 events 将被拒绝。不支持 historical backfill——请在一小时内 flush buffered events。Usage-Based Billing Analytics
使用 comprehensive analytics dashboard 监控和分析 usage-based billing data。跟踪 customer consumption patterns、meter performance 和 billing trends,以优化 pricing strategy 并了解 usage behaviors。Overview Analytics
Overview tab 提供 usage-based billing performance 的 comprehensive view:Activity Metrics
跟踪不同时间段的关键 usage statistics:metric
显示当前 billing period 的 usage activity,帮助你了解 monthly consumption patterns。
metric
显示自开始 tracking 以来的 cumulative usage statistics,提供长期 growth insights。
Meter Quantities Chart
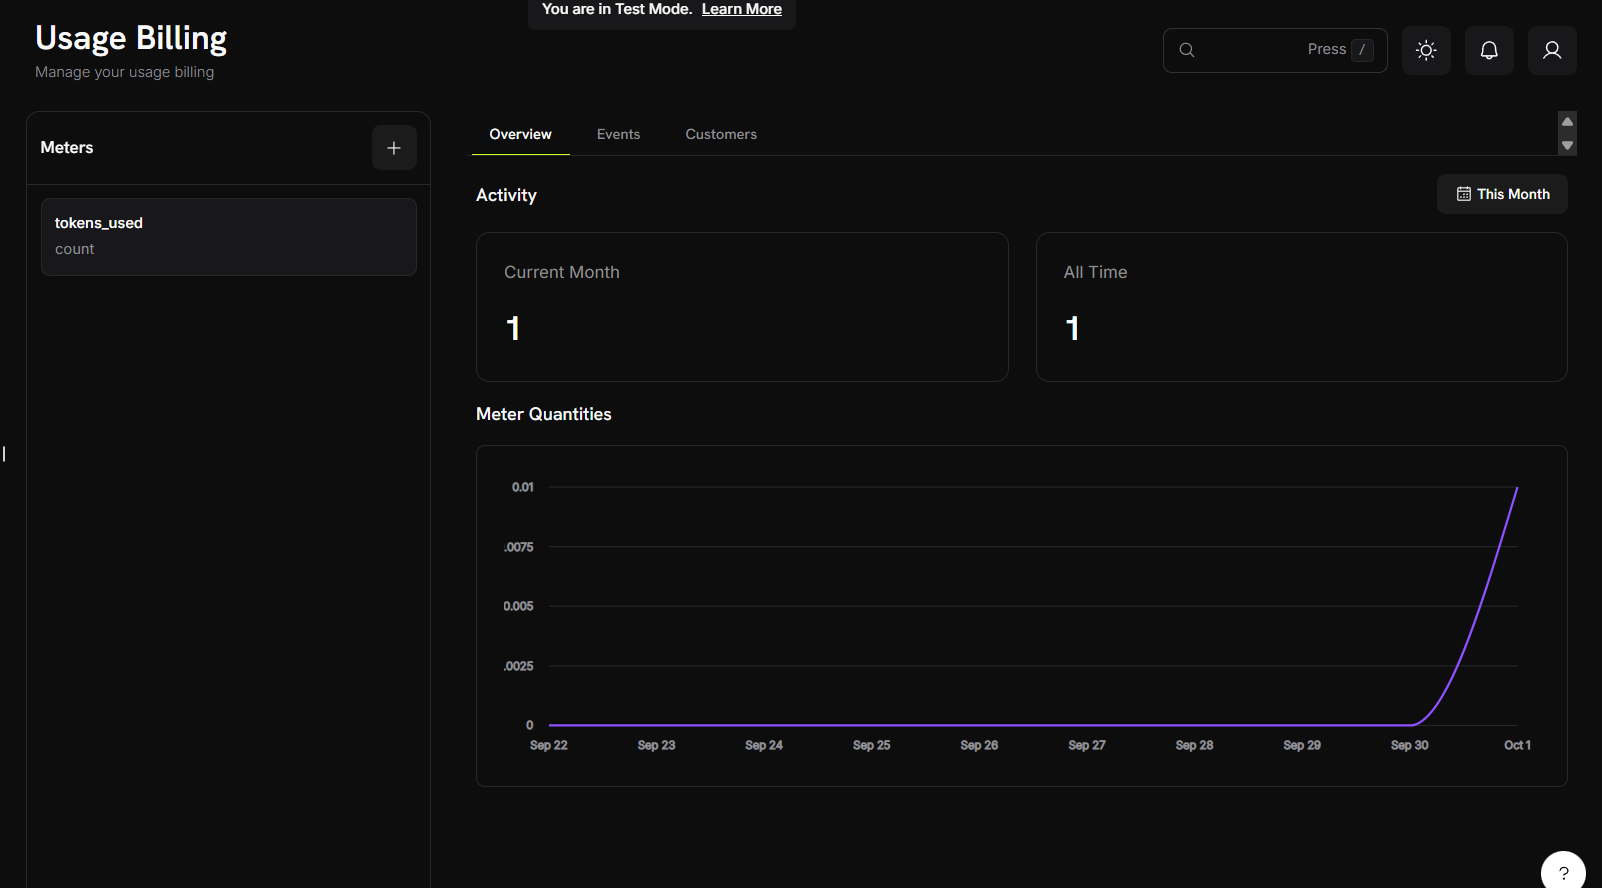
- Time-series visualization:跟踪 days、weeks 或 months 中的 usage patterns
- Multiple meter support:同时查看不同 meters 的 data
- Trend analysis:识别 usage spikes、patterns 和 growth trajectories
Chart 会根据 usage volume 和所选 time range 自动缩放,让你清晰了解细微 fluctuations 和重大 usage changes。
Events Analytics
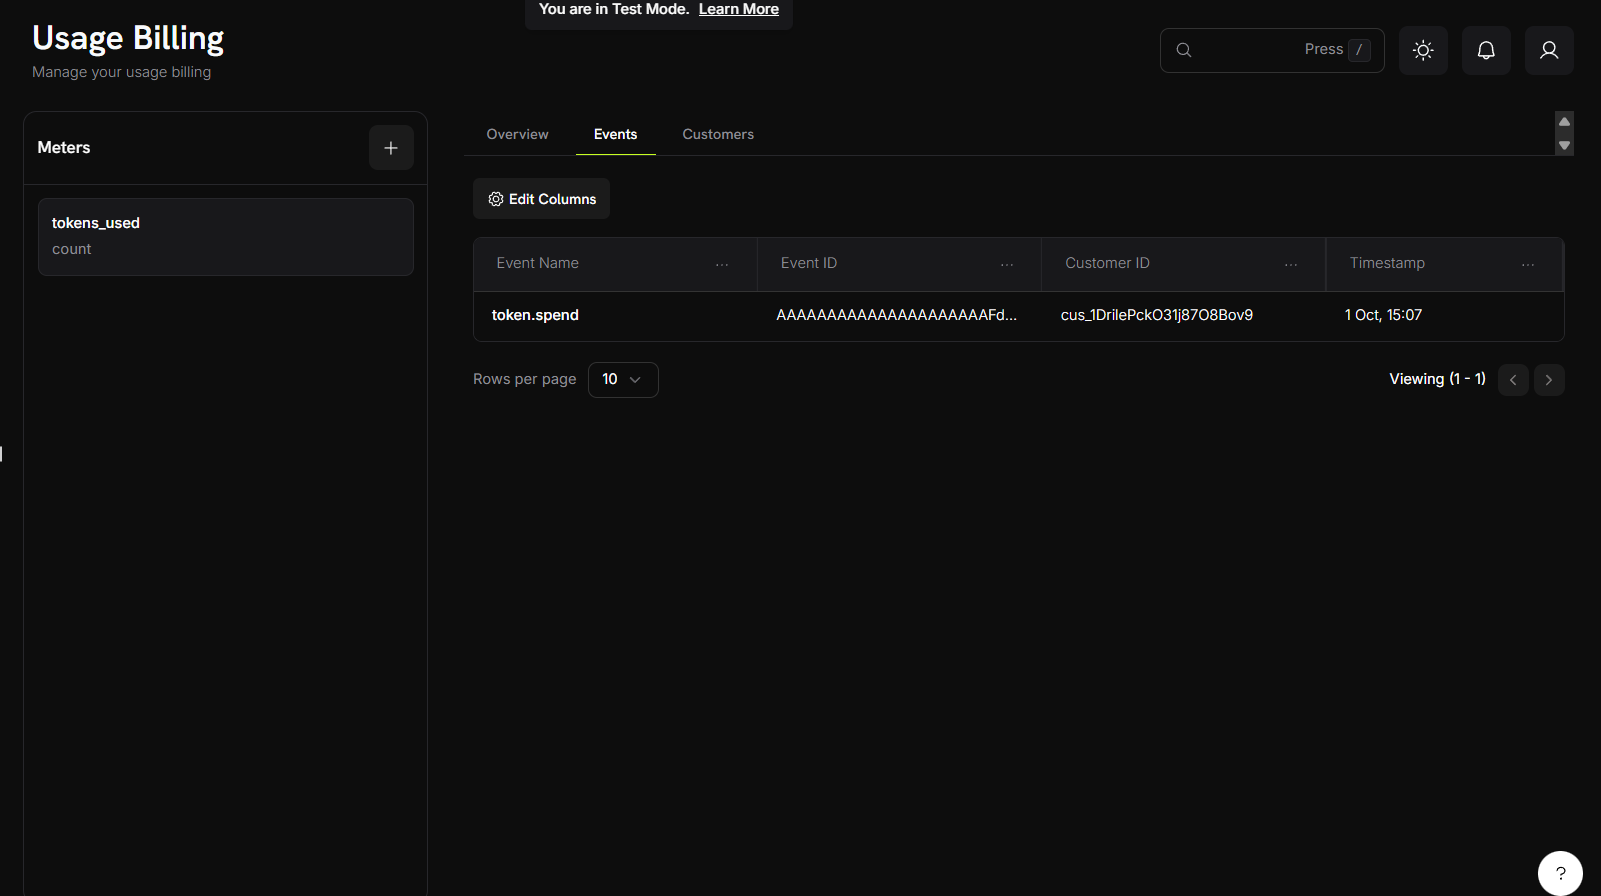
Event Information Display
Events table 通过以下 columns 清晰展示 individual usage events:- Event Name:生成 usage event 的具体 action 或 trigger
- Event ID:每个 event instance 的唯一 identifier
- Customer ID:与 event 关联的 customer
- Timestamp:event 发生的时间
此 view 允许你跨 customer base 跟踪和监控 individual usage events,并透明地了解 billing calculations 和 usage patterns。
Customer Analytics
Customers tab 提供 customer usage data 的详细 table view,其中包含以下 information:Available Data Columns
string
用于识别 customer 的 email address。
string
Customer subscription 的唯一 identifier。
number
Customer plan 中在产生 charges 前包含的 free units 数量。
currency
超过 free threshold 后 usage 的 cost per unit。
timestamp
Customer 最近一次 usage event 的 timestamp。
currency
根据 usage-based billing 向 customer 收取的 total amount。
number
Customer 已消耗的 total number of units。
number
超过 free threshold 且正在计费的 units 数量。
Table Features
- Column Filtering:使用 “Edit Columns” feature 显示或隐藏特定 data columns
- Real-time Updates:Usage data 反映最新的 consumption metrics
Aggregation Examples
以下是不同 aggregation types 工作方式的实际示例:Understanding Aggregation Types
不同的 aggregation types 适用于不同的 billing scenarios。根据你希望如何测量和收取 usage,选择合适的 type。Practical Implementation Examples
这些 examples 展示了每种 aggregation type 的 real-world applications,以及 sample events 和 expected results:Count Aggregation — API Calls
Count Aggregation — API Calls
场景:跟踪 API requests 的总数量Meter Configuration:结果:向 customer 收取 3 次 calls 的费用
- Event Name:
api.call - Aggregation Type:Count
- Measurement Unit:
calls
Sum Aggregation — Data Transfer
Sum Aggregation — Data Transfer
场景:根据传输的 total bytes 计费Meter Configuration:结果:向 customer 收取 1.5 GB total transfer 的费用
- Event Name:
data.transfer - Aggregation Type:Sum
- Over Property:
bytes - Measurement Unit:
GB
Max Aggregation — Peak Concurrent Users
Max Aggregation — Peak Concurrent Users
场景:根据最高 concurrent user count 计费Meter Configuration:结果:向 customer 收取 23 个 peak concurrent users 的费用
- Event Name:
concurrent.users - Aggregation Type:Max
- Over Property:
count - Measurement Unit:
users
Event Filtering Examples
- Filter by API Endpoint
- Filter by Value Range
- Complex Multi-Condition Filters
仅统计对特定 endpoints 的 API calls:Filter Configuration:结果:符合 filter criteria 的 events 会被计数。不同 endpoints 的 events 会被忽略。
- Property:
endpoint - Comparator:
equals - Value:
/v1/orders
Troubleshooting
解决 usage-based billing implementation 中的常见问题,确保 tracking 和 billing 准确无误。Common Issues
大多数 usage-based billing problems 属于以下 categories:- Event delivery 和 processing issues
- Meter configuration problems
- Data type 和 formatting errors
- Customer ID 和 authentication issues
Debugging Steps
排查 usage-based billing 时:- 在 Events analytics tab 中验证 event delivery
- 检查 meter configuration 是否与 event structure 匹配
- 验证 customer IDs 和 API authentication
- 检查 filtering conditions 和 aggregation settings
Solutions and Fixes
Events not showing in meter
Events not showing in meter
常见原因:
- Event name 与 meter configuration 不完全匹配
- Event filtering conditions 排除了你的 events
- Customer ID 不存在于你的 Dodo Payments account 中
- Event timestamp 位于当前 billing period 之外
- 验证 event name 的 spelling 和 case sensitivity
- 检查并测试 filtering conditions
- 确认 customer ID 有效且处于 active 状态
- 检查 event timestamps 是否为 recent 且格式正确
Aggregation not working as expected
Aggregation not working as expected
常见原因:
- Over Property name 与 event metadata keys 不匹配
- Metadata values 的 data type 错误(string 而非 number)
- 缺少 required metadata properties
- 确保 metadata keys 与 Over Property setting 完全匹配
- 在 events 中将 string numbers 转换为实际的 numbers
- 在每个 event 中包含所有 required properties
Filtering not working
Filtering not working
常见原因:
- Filter property names 与 event metadata 不匹配
- Data type 使用了错误的 comparator(string 而非 number)
- String comparisons 存在 case sensitivity
- 仔细检查 property names 是否完全匹配
- 针对 data types 使用合适的 comparators
- Filtering strings 时考虑 case sensitivity