> ## Documentation Index
> Fetch the complete documentation index at: https://docs.dodopayments.com/llms.txt
> Use this file to discover all available pages before exploring further.
# 대시보드 분석
> 도도 페이먼츠의 Analytics & Reporting 대시보드로 실질적인 비즈니스 인사이트를 확보하세요. 비즈니스 전체와 각 제품 수준에서 수익, 고객, 유지율, 거래 건전성을 추적할 수 있습니다.
 ## 소개
Dodo Payments의 **분석 및 보고서** 대시보드는 비즈니스 성과를 모니터링하고, 고객 행동을 이해하며, 데이터 기반 결정을 내릴 수 있도록 도와줍니다. 실시간 지표에 접근하고, 동향을 시각화하며, 상세 보고서를 내보내세요. 모든 것을 단일 직관적인 인터페이스에서 가능합니다.
전체 비즈니스의 총 수익, 고객, 유지율 및 거래 건전성을 추적하세요.
개별 제품의 실적—수익, 고객, 이탈, 구독자, MRR—을 세부적으로 분석하세요.
결제 및 환불 성공률을 모니터링하고 실패 원인을 파악하세요.
맞춤 날짜 범위의 결제, 환불, 지급 보고서를 다운로드하세요.
***
## 비즈니스 수준 분석
주요 분석 대시보드는 전체 비즈니스에 대한 포괄적인 통찰력을 제공합니다. 사이드바의 **홈**에서 액세스할 수 있습니다.
### 수익 분석
수익과 결제 활동을 추적하여 수익 추세를 이해하고 최고의 실적 시장을 파악하세요.
## 소개
Dodo Payments의 **분석 및 보고서** 대시보드는 비즈니스 성과를 모니터링하고, 고객 행동을 이해하며, 데이터 기반 결정을 내릴 수 있도록 도와줍니다. 실시간 지표에 접근하고, 동향을 시각화하며, 상세 보고서를 내보내세요. 모든 것을 단일 직관적인 인터페이스에서 가능합니다.
전체 비즈니스의 총 수익, 고객, 유지율 및 거래 건전성을 추적하세요.
개별 제품의 실적—수익, 고객, 이탈, 구독자, MRR—을 세부적으로 분석하세요.
결제 및 환불 성공률을 모니터링하고 실패 원인을 파악하세요.
맞춤 날짜 범위의 결제, 환불, 지급 보고서를 다운로드하세요.
***
## 비즈니스 수준 분석
주요 분석 대시보드는 전체 비즈니스에 대한 포괄적인 통찰력을 제공합니다. 사이드바의 **홈**에서 액세스할 수 있습니다.
### 수익 분석
수익과 결제 활동을 추적하여 수익 추세를 이해하고 최고의 실적 시장을 파악하세요.
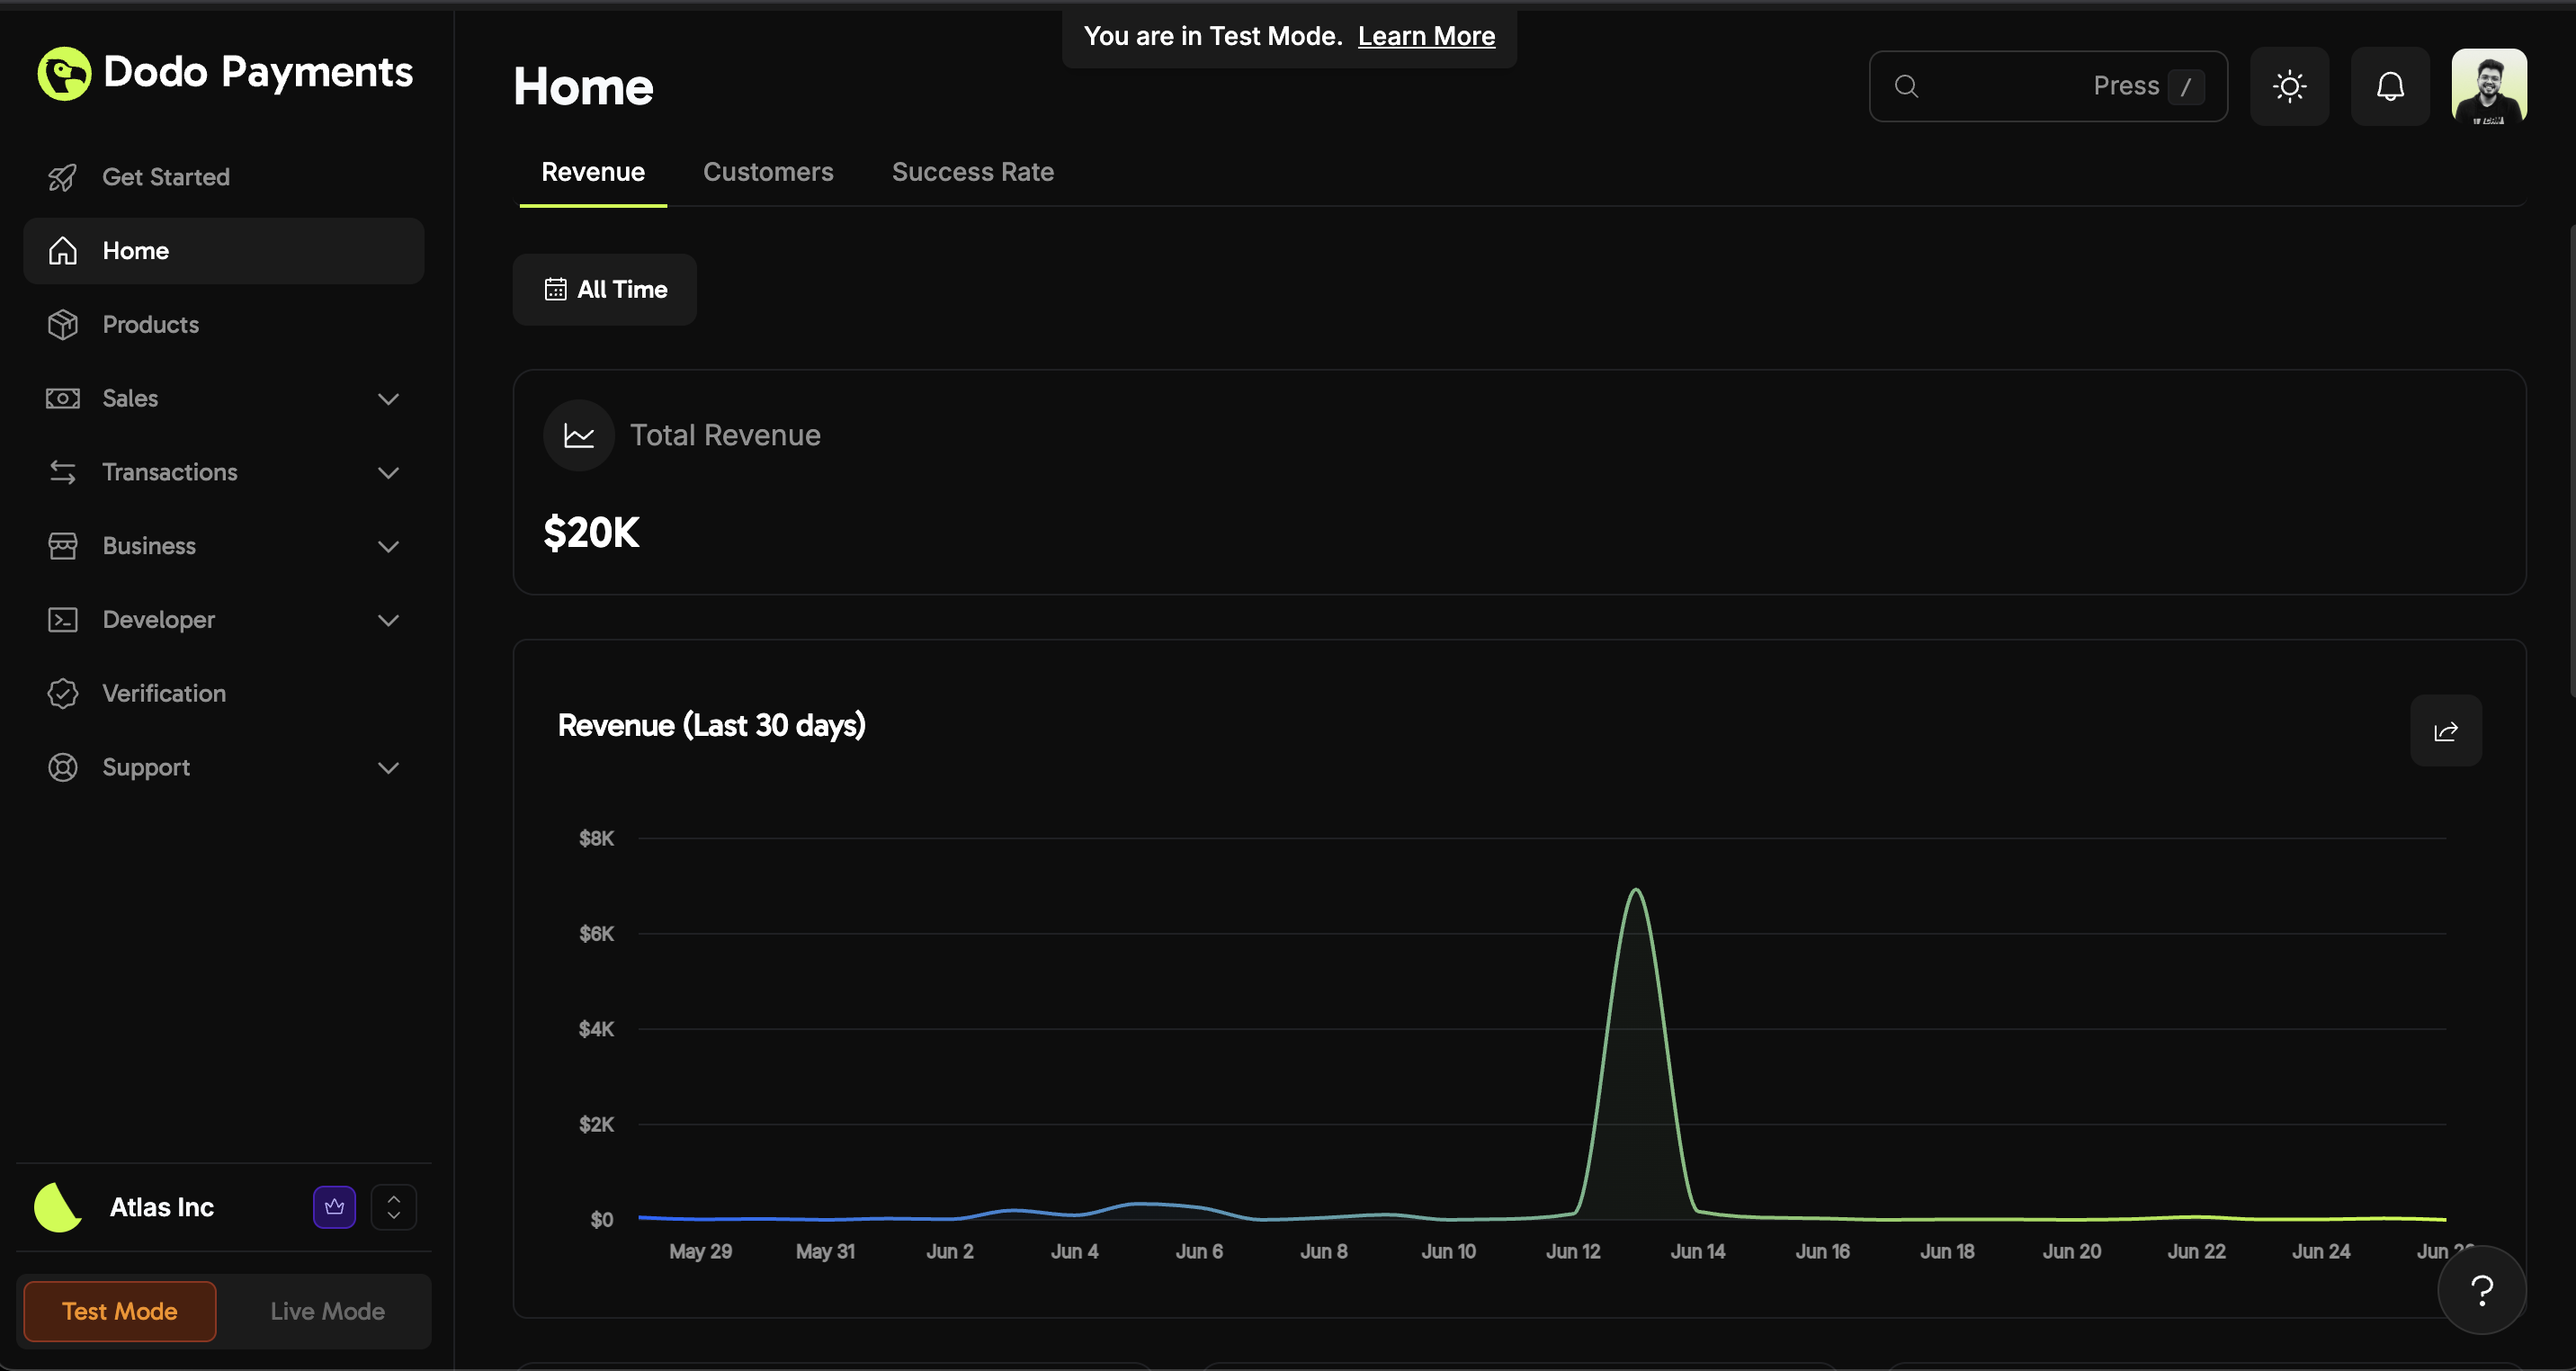 * **총 수익:** 전체 수익과 최근 트렌드를 즉시 확인하세요.
* **순수익:** 환불, 분쟁, 수수료를 제외한 실제 수익을 확인하여 실제 비즈니스 성과를 명확히 파악하세요.
* **수익 추세:** 30일 차트를 통해 수익의 급증이나 감소를 식별할 수 있습니다.
* **총 수익:** 전체 수익과 최근 트렌드를 즉시 확인하세요.
* **순수익:** 환불, 분쟁, 수수료를 제외한 실제 수익을 확인하여 실제 비즈니스 성과를 명확히 파악하세요.
* **수익 추세:** 30일 차트를 통해 수익의 급증이나 감소를 식별할 수 있습니다.
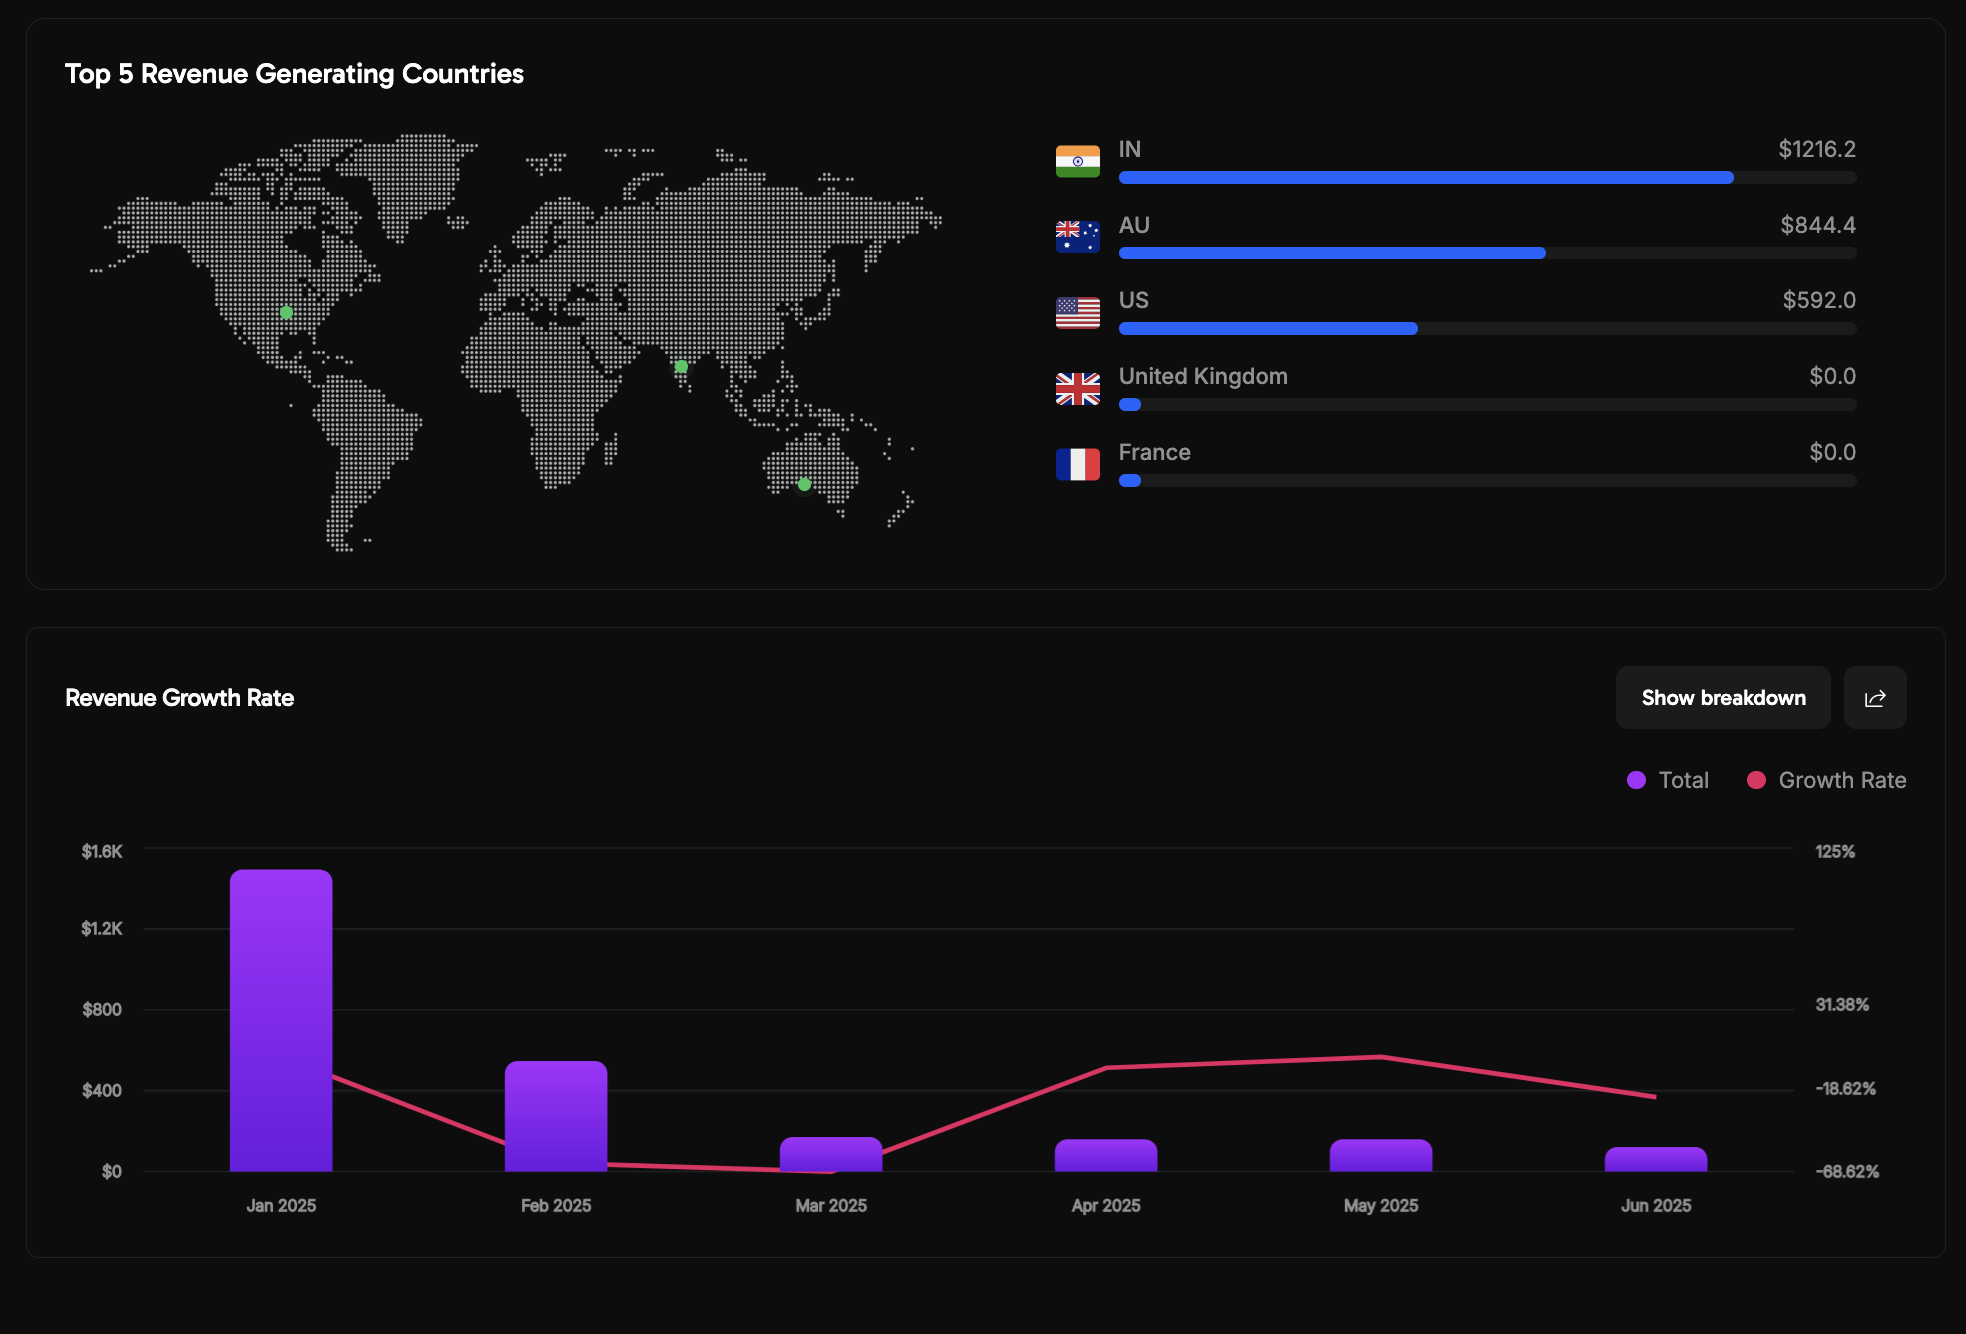 * **Growth Rate:** 비즈니스 모멘텀을 측정하기 위해 월별 수익 성장률을 추적하세요.
* **Geographic Insights:** 수익이 가장 높은 상위 5개 국가를 시각화하세요.
이 인사이트를 활용해 고성능 지역과 성장 기간에 마케팅 및 제품 노력을 집중하세요.
### 수익 세부 분해
상세 분해를 통해 반복 수익 지표를 추적하세요:
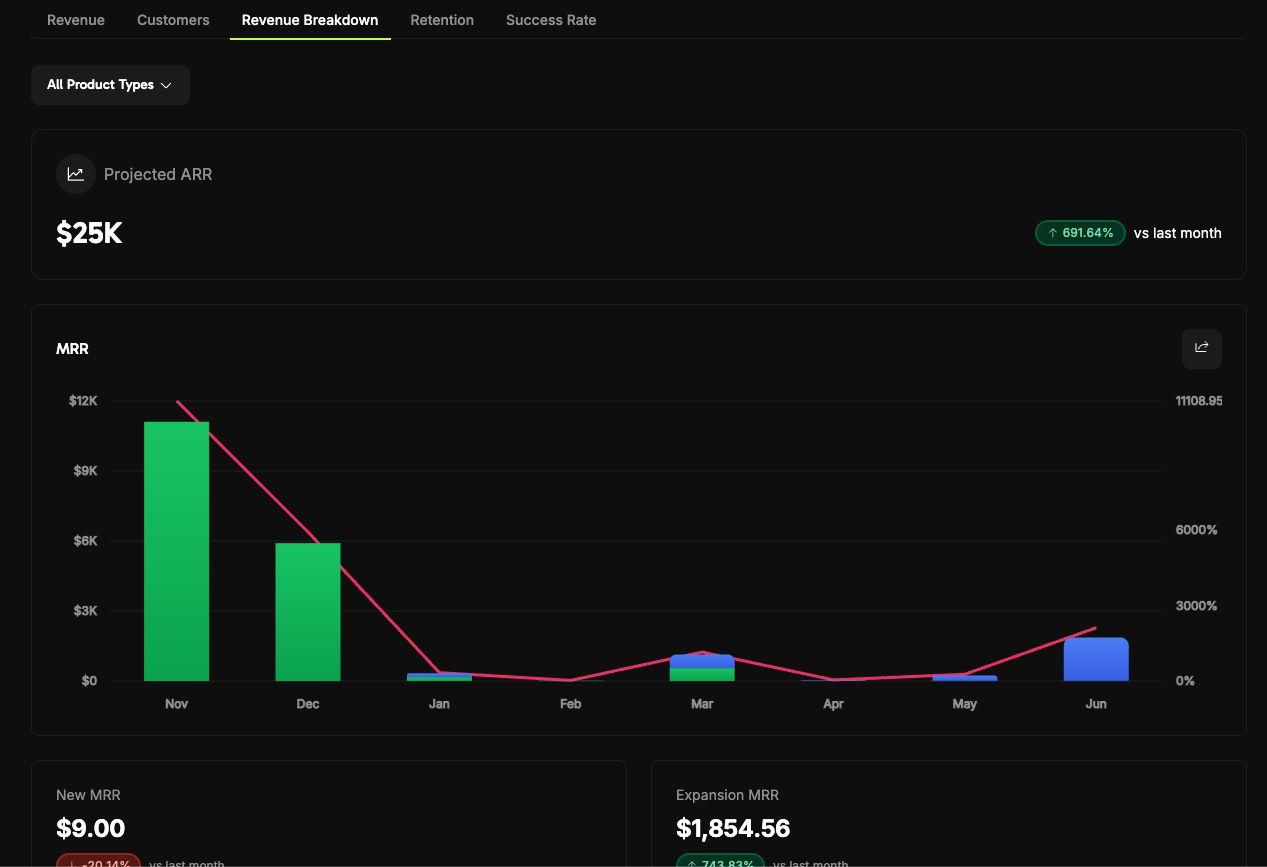
* **Projected ARR**: 추세 분석과 함께 제공되는 연간 반복 수익 예측
* **MRR Breakdown and Growth Rate**: 월별 반복 수익 분석과 전월 대비 성장률
* **New MRR Chart**: 신규 고객 수익 확보를 시각화
* **Expansion MRR Chart**: 기존 고객 업그레이드 및 확장으로 인한 수익 증가 추적
* **Churn MRR Chart**: 고객 취소 및 다운그레이드로 손실된 수익 모니터링
* **Net New MRR Chart**: 신규, 확장, 이탈 MRR을 결합한 순 수익 영향
* **Growth Rate:** 비즈니스 모멘텀을 측정하기 위해 월별 수익 성장률을 추적하세요.
* **Geographic Insights:** 수익이 가장 높은 상위 5개 국가를 시각화하세요.
이 인사이트를 활용해 고성능 지역과 성장 기간에 마케팅 및 제품 노력을 집중하세요.
### 수익 세부 분해
상세 분해를 통해 반복 수익 지표를 추적하세요:
* **Projected ARR**: 추세 분석과 함께 제공되는 연간 반복 수익 예측
* **MRR Breakdown and Growth Rate**: 월별 반복 수익 분석과 전월 대비 성장률
* **New MRR Chart**: 신규 고객 수익 확보를 시각화
* **Expansion MRR Chart**: 기존 고객 업그레이드 및 확장으로 인한 수익 증가 추적
* **Churn MRR Chart**: 고객 취소 및 다운그레이드로 손실된 수익 모니터링
* **Net New MRR Chart**: 신규, 확장, 이탈 MRR을 결합한 순 수익 영향
 ### 리텐션 분석
고객 유지 및 이탈 패턴을 모니터링하세요:
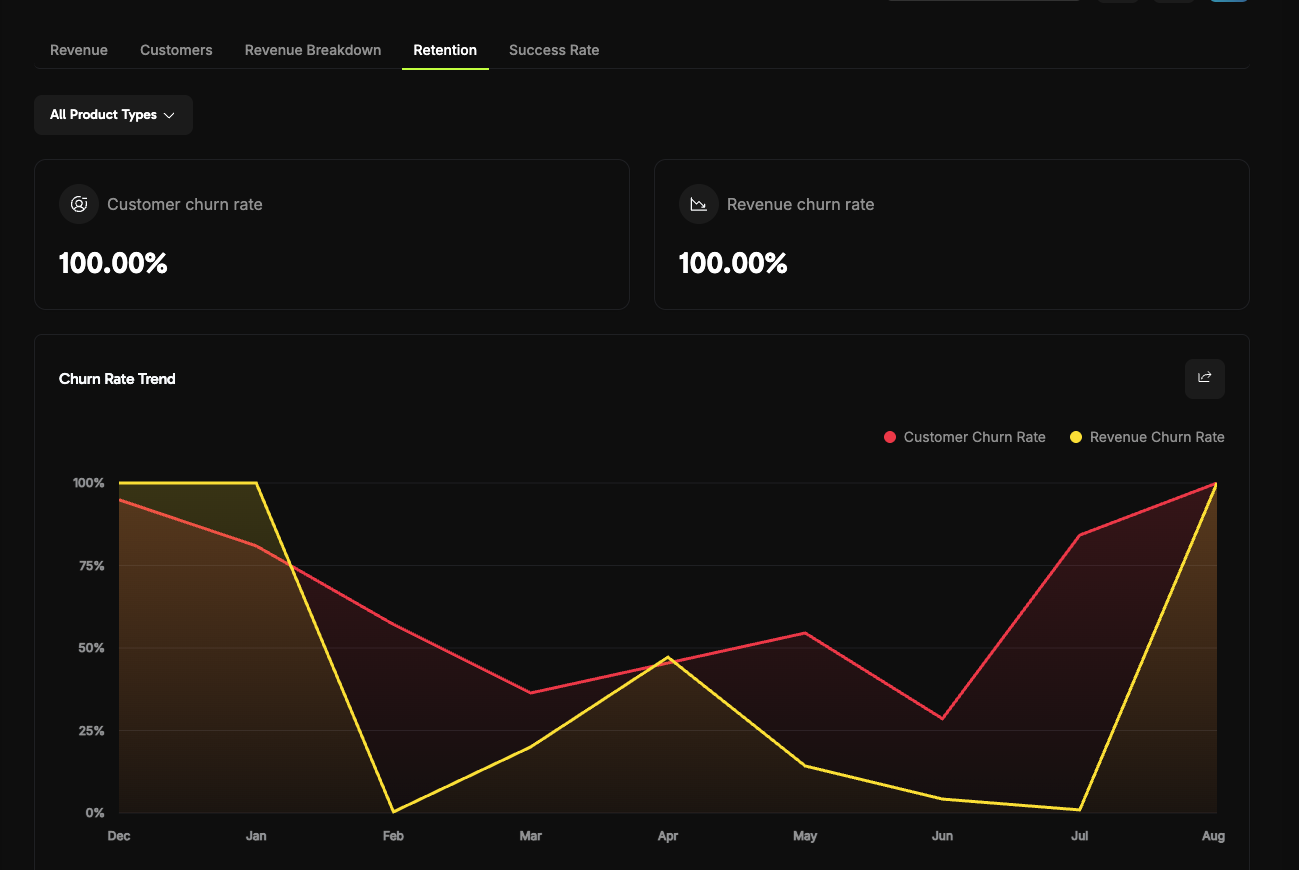
* **Customer Churn Rate**: 구독을 취소한 고객 비율
* **Revenue Churn Rate**: 취소 및 다운그레이드로 손실된 수익 비율
* **Churn Rate Trends**: 시간 경과에 따른 고객 및 수익 이탈 패턴 추적
* **User Retention Matrix**: 다양한 기간에 대한 고객 유지율을 보여주는 코호트 분석
### 리텐션 분석
고객 유지 및 이탈 패턴을 모니터링하세요:
* **Customer Churn Rate**: 구독을 취소한 고객 비율
* **Revenue Churn Rate**: 취소 및 다운그레이드로 손실된 수익 비율
* **Churn Rate Trends**: 시간 경과에 따른 고객 및 수익 이탈 패턴 추적
* **User Retention Matrix**: 다양한 기간에 대한 고객 유지율을 보여주는 코호트 분석
 ### 고객 분석
고객 확보, 유지, 지출 패턴을 분석하여 고객 전략을 최적화하세요.
### 고객 분석
고객 확보, 유지, 지출 패턴을 분석하여 고객 전략을 최적화하세요.
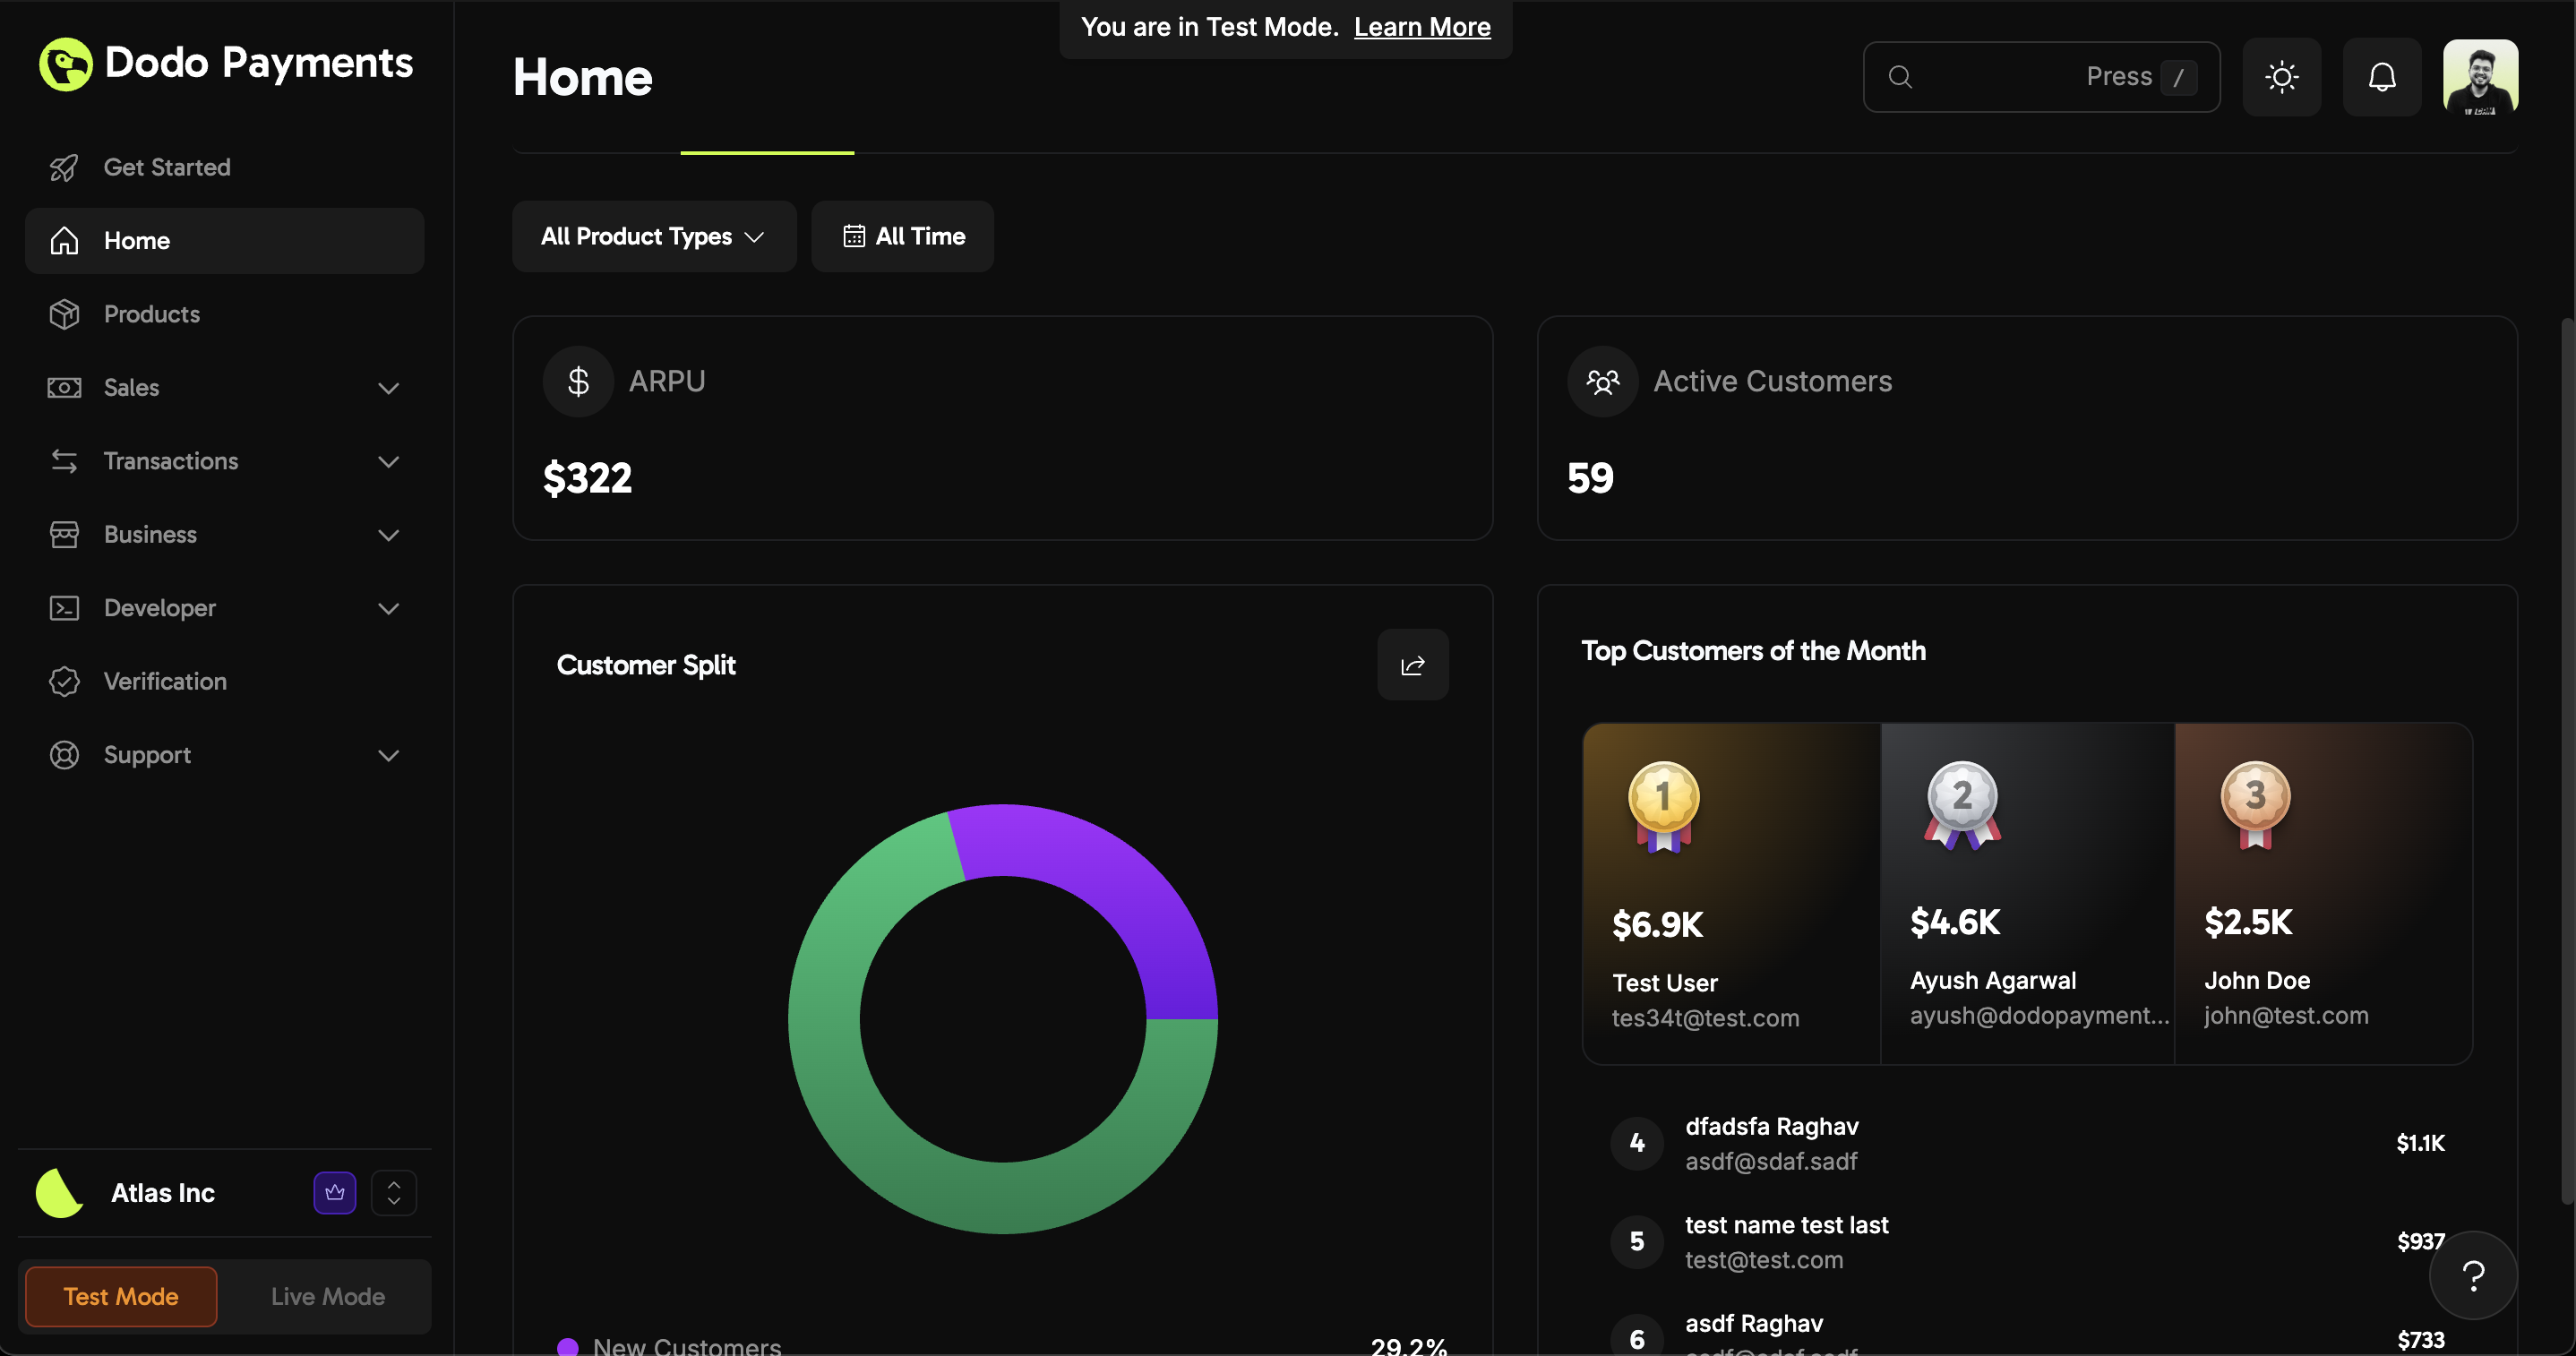 * **ARPU (Average Revenue Per User):** 고객 1인당 평균 기여도를 이해하세요.
* **Active Customers:** 비즈니스에 참여하는 고객 수를 확인하세요.
* **Customer Split:** 신규 대 재방문 고객 비율을 즉시 확인하세요.
* **Top Customers:** 표적 참여를 위해 가장 많이 지출한 고객을 식별하세요.
ARPU와 고객 분할을 모니터링하여 유지 및 확보 전략을 정교화하세요.
### 거래 성공 및 실패
결제 및 환불 성공률을 모니터링하여 거래 문제를 신속히 해결하세요.
* **ARPU (Average Revenue Per User):** 고객 1인당 평균 기여도를 이해하세요.
* **Active Customers:** 비즈니스에 참여하는 고객 수를 확인하세요.
* **Customer Split:** 신규 대 재방문 고객 비율을 즉시 확인하세요.
* **Top Customers:** 표적 참여를 위해 가장 많이 지출한 고객을 식별하세요.
ARPU와 고객 분할을 모니터링하여 유지 및 확보 전략을 정교화하세요.
### 거래 성공 및 실패
결제 및 환불 성공률을 모니터링하여 거래 문제를 신속히 해결하세요.
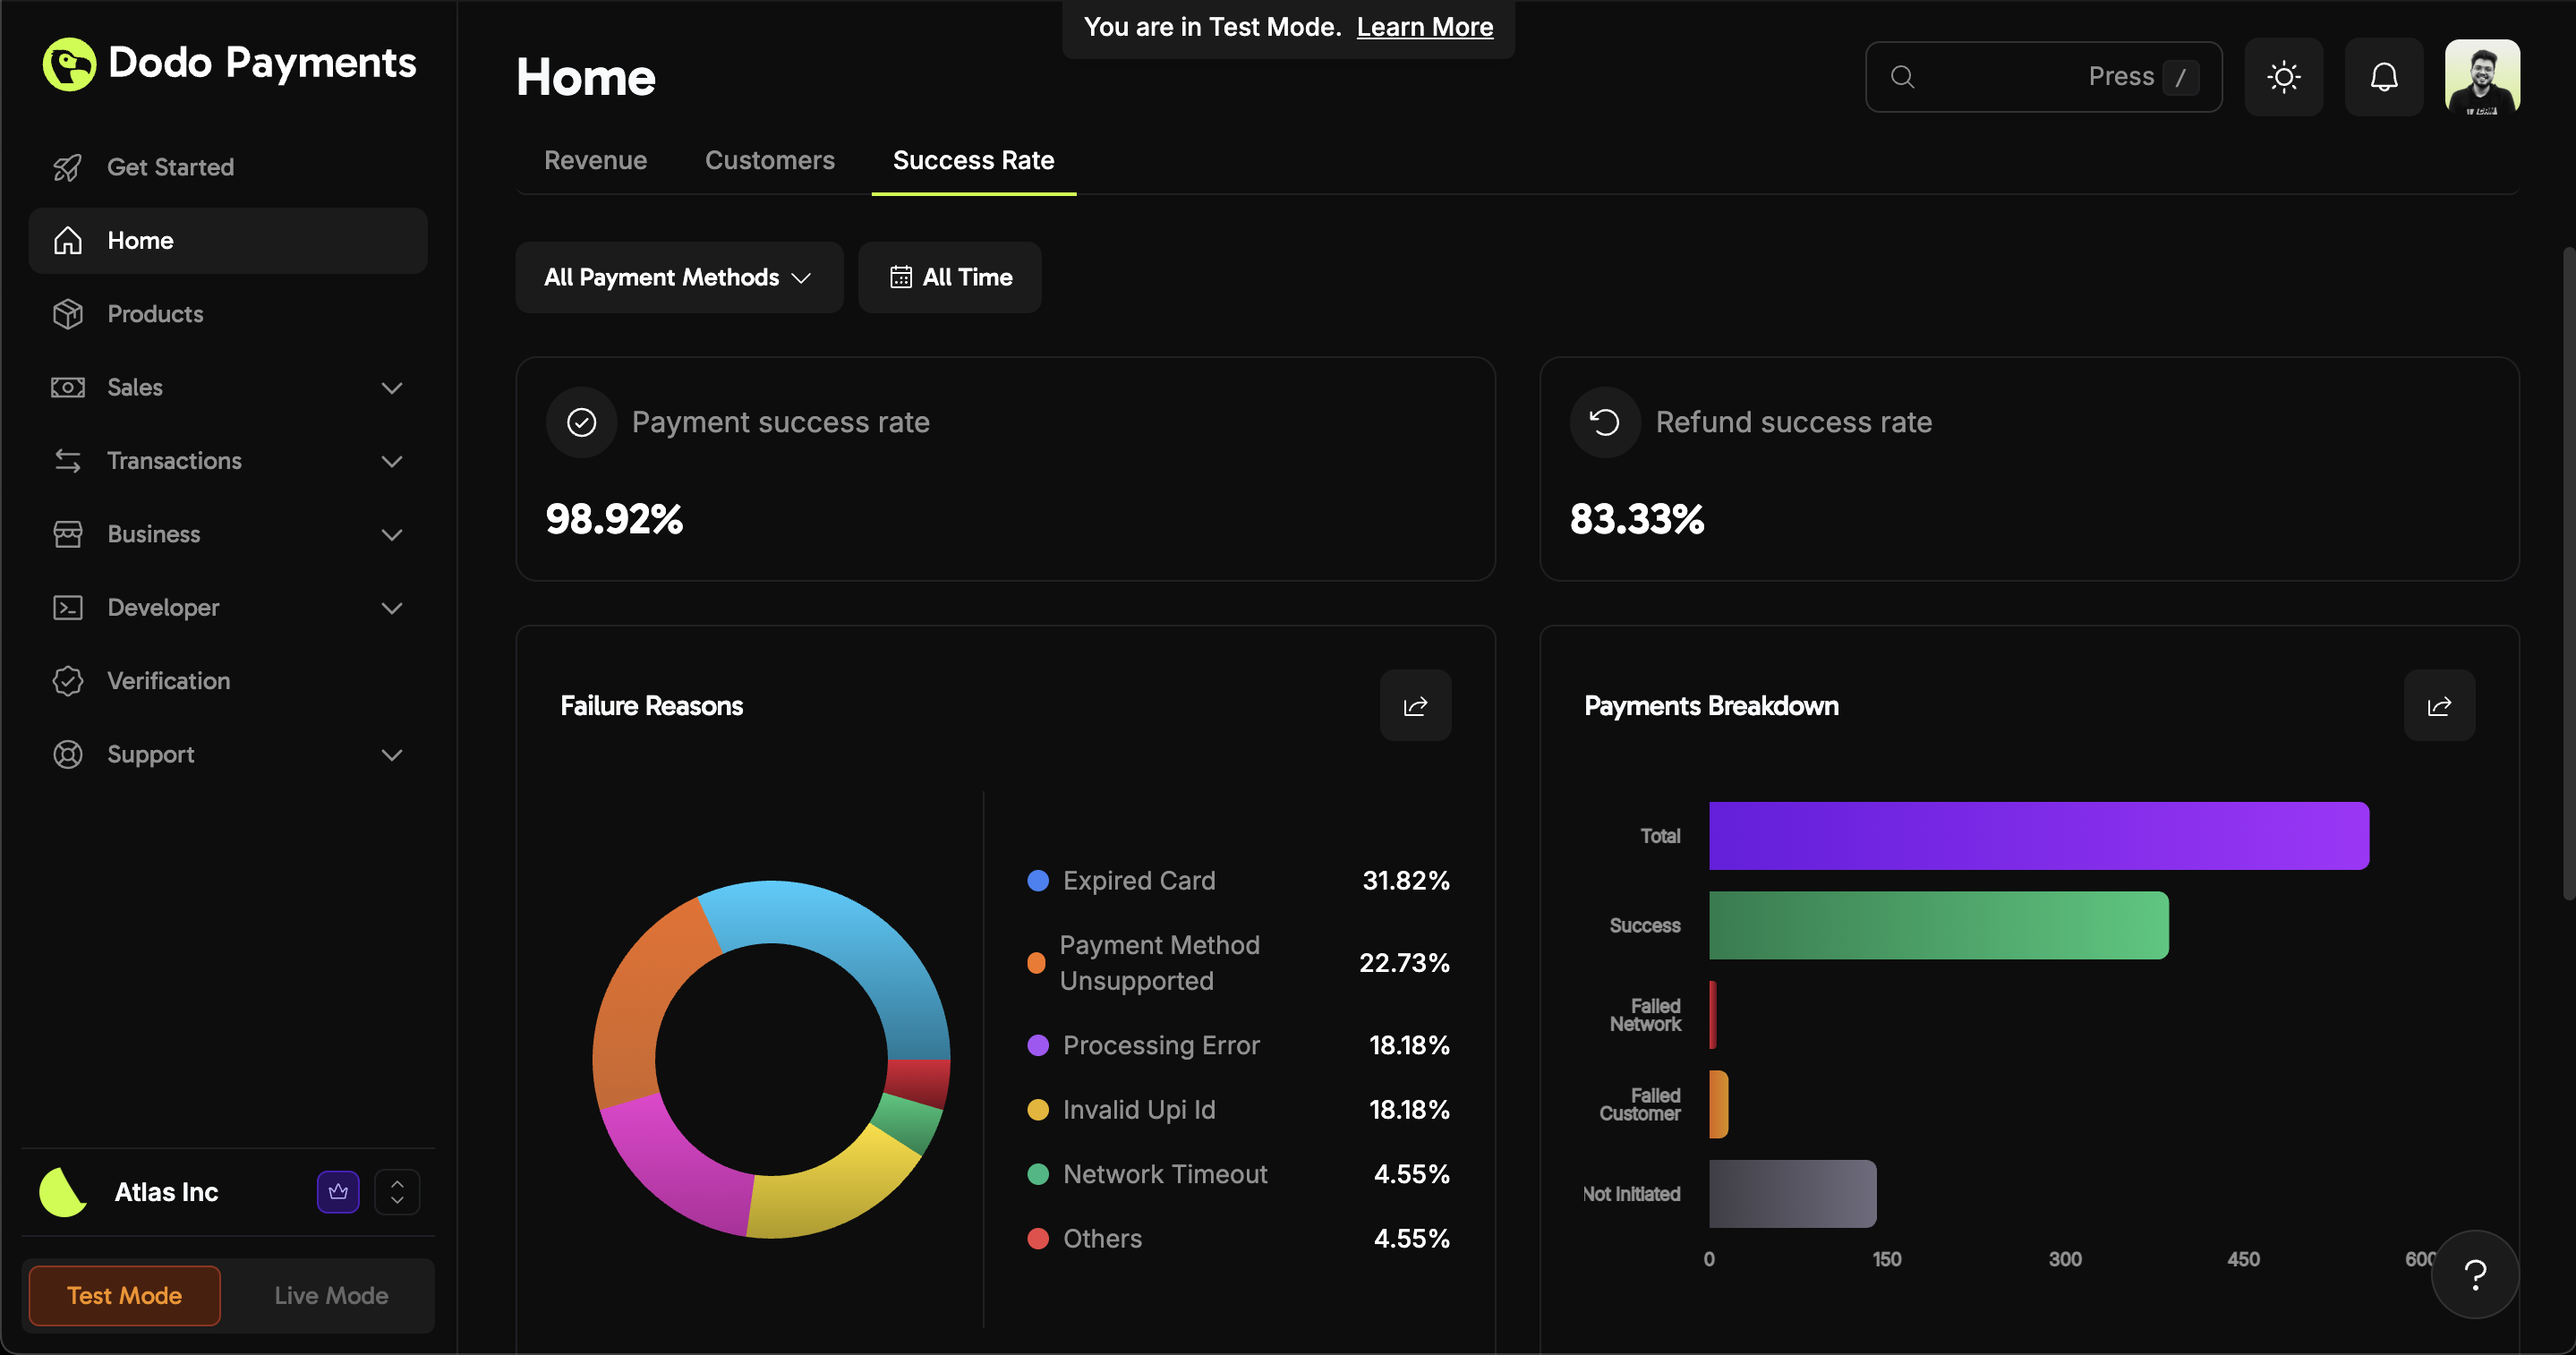 * **Payment Success Rate:** 성공한 결제 시도 비율을 추적하세요.
* **Refund Success Rate:** 성공적으로 처리된 환불 건수를 모니터링하세요.
* **Failure Reasons:** 만료된 카드, 지원되지 않는 수단 등 일반적인 문제를 빠르게 파악하세요.
가능한 모든 거래 실패 코드와 그 이유를 확인하세요.
* **Payments Breakdown:** 성공한 거래와 실패한 거래의 분포를 시각화하세요.
성공률이 떨어지거나 실패가 급증하면 실패 원인을 검토하고 즉시 해결하여 수익 손실을 최소화하세요.
### 필터링 및 사용자 지정
다음 기준으로 분석 데이터를 필터링할 수 있습니다:
* **Product Type** (원타임 결제 vs. 구독)
* **Date Range** (사용자 지정 가능)
* **Payment Method**
필터를 사용하여 특정 제품, 기간 또는 결제 수단에 대한 세부 인사이트를 얻으세요.
***
## 제품 수준 분석
비즈니스 전체 지표 외에도 **각 개별 제품**에 대한 상세 분석을 확인할 수 있습니다. \*\*Products > \[제품 선택]\*\*으로 이동하여 해당 제품 전용 분석 대시보드에 접근하세요.
* **Payment Success Rate:** 성공한 결제 시도 비율을 추적하세요.
* **Refund Success Rate:** 성공적으로 처리된 환불 건수를 모니터링하세요.
* **Failure Reasons:** 만료된 카드, 지원되지 않는 수단 등 일반적인 문제를 빠르게 파악하세요.
가능한 모든 거래 실패 코드와 그 이유를 확인하세요.
* **Payments Breakdown:** 성공한 거래와 실패한 거래의 분포를 시각화하세요.
성공률이 떨어지거나 실패가 급증하면 실패 원인을 검토하고 즉시 해결하여 수익 손실을 최소화하세요.
### 필터링 및 사용자 지정
다음 기준으로 분석 데이터를 필터링할 수 있습니다:
* **Product Type** (원타임 결제 vs. 구독)
* **Date Range** (사용자 지정 가능)
* **Payment Method**
필터를 사용하여 특정 제품, 기간 또는 결제 수단에 대한 세부 인사이트를 얻으세요.
***
## 제품 수준 분석
비즈니스 전체 지표 외에도 **각 개별 제품**에 대한 상세 분석을 확인할 수 있습니다. \*\*Products > \[제품 선택]\*\*으로 이동하여 해당 제품 전용 분석 대시보드에 접근하세요.
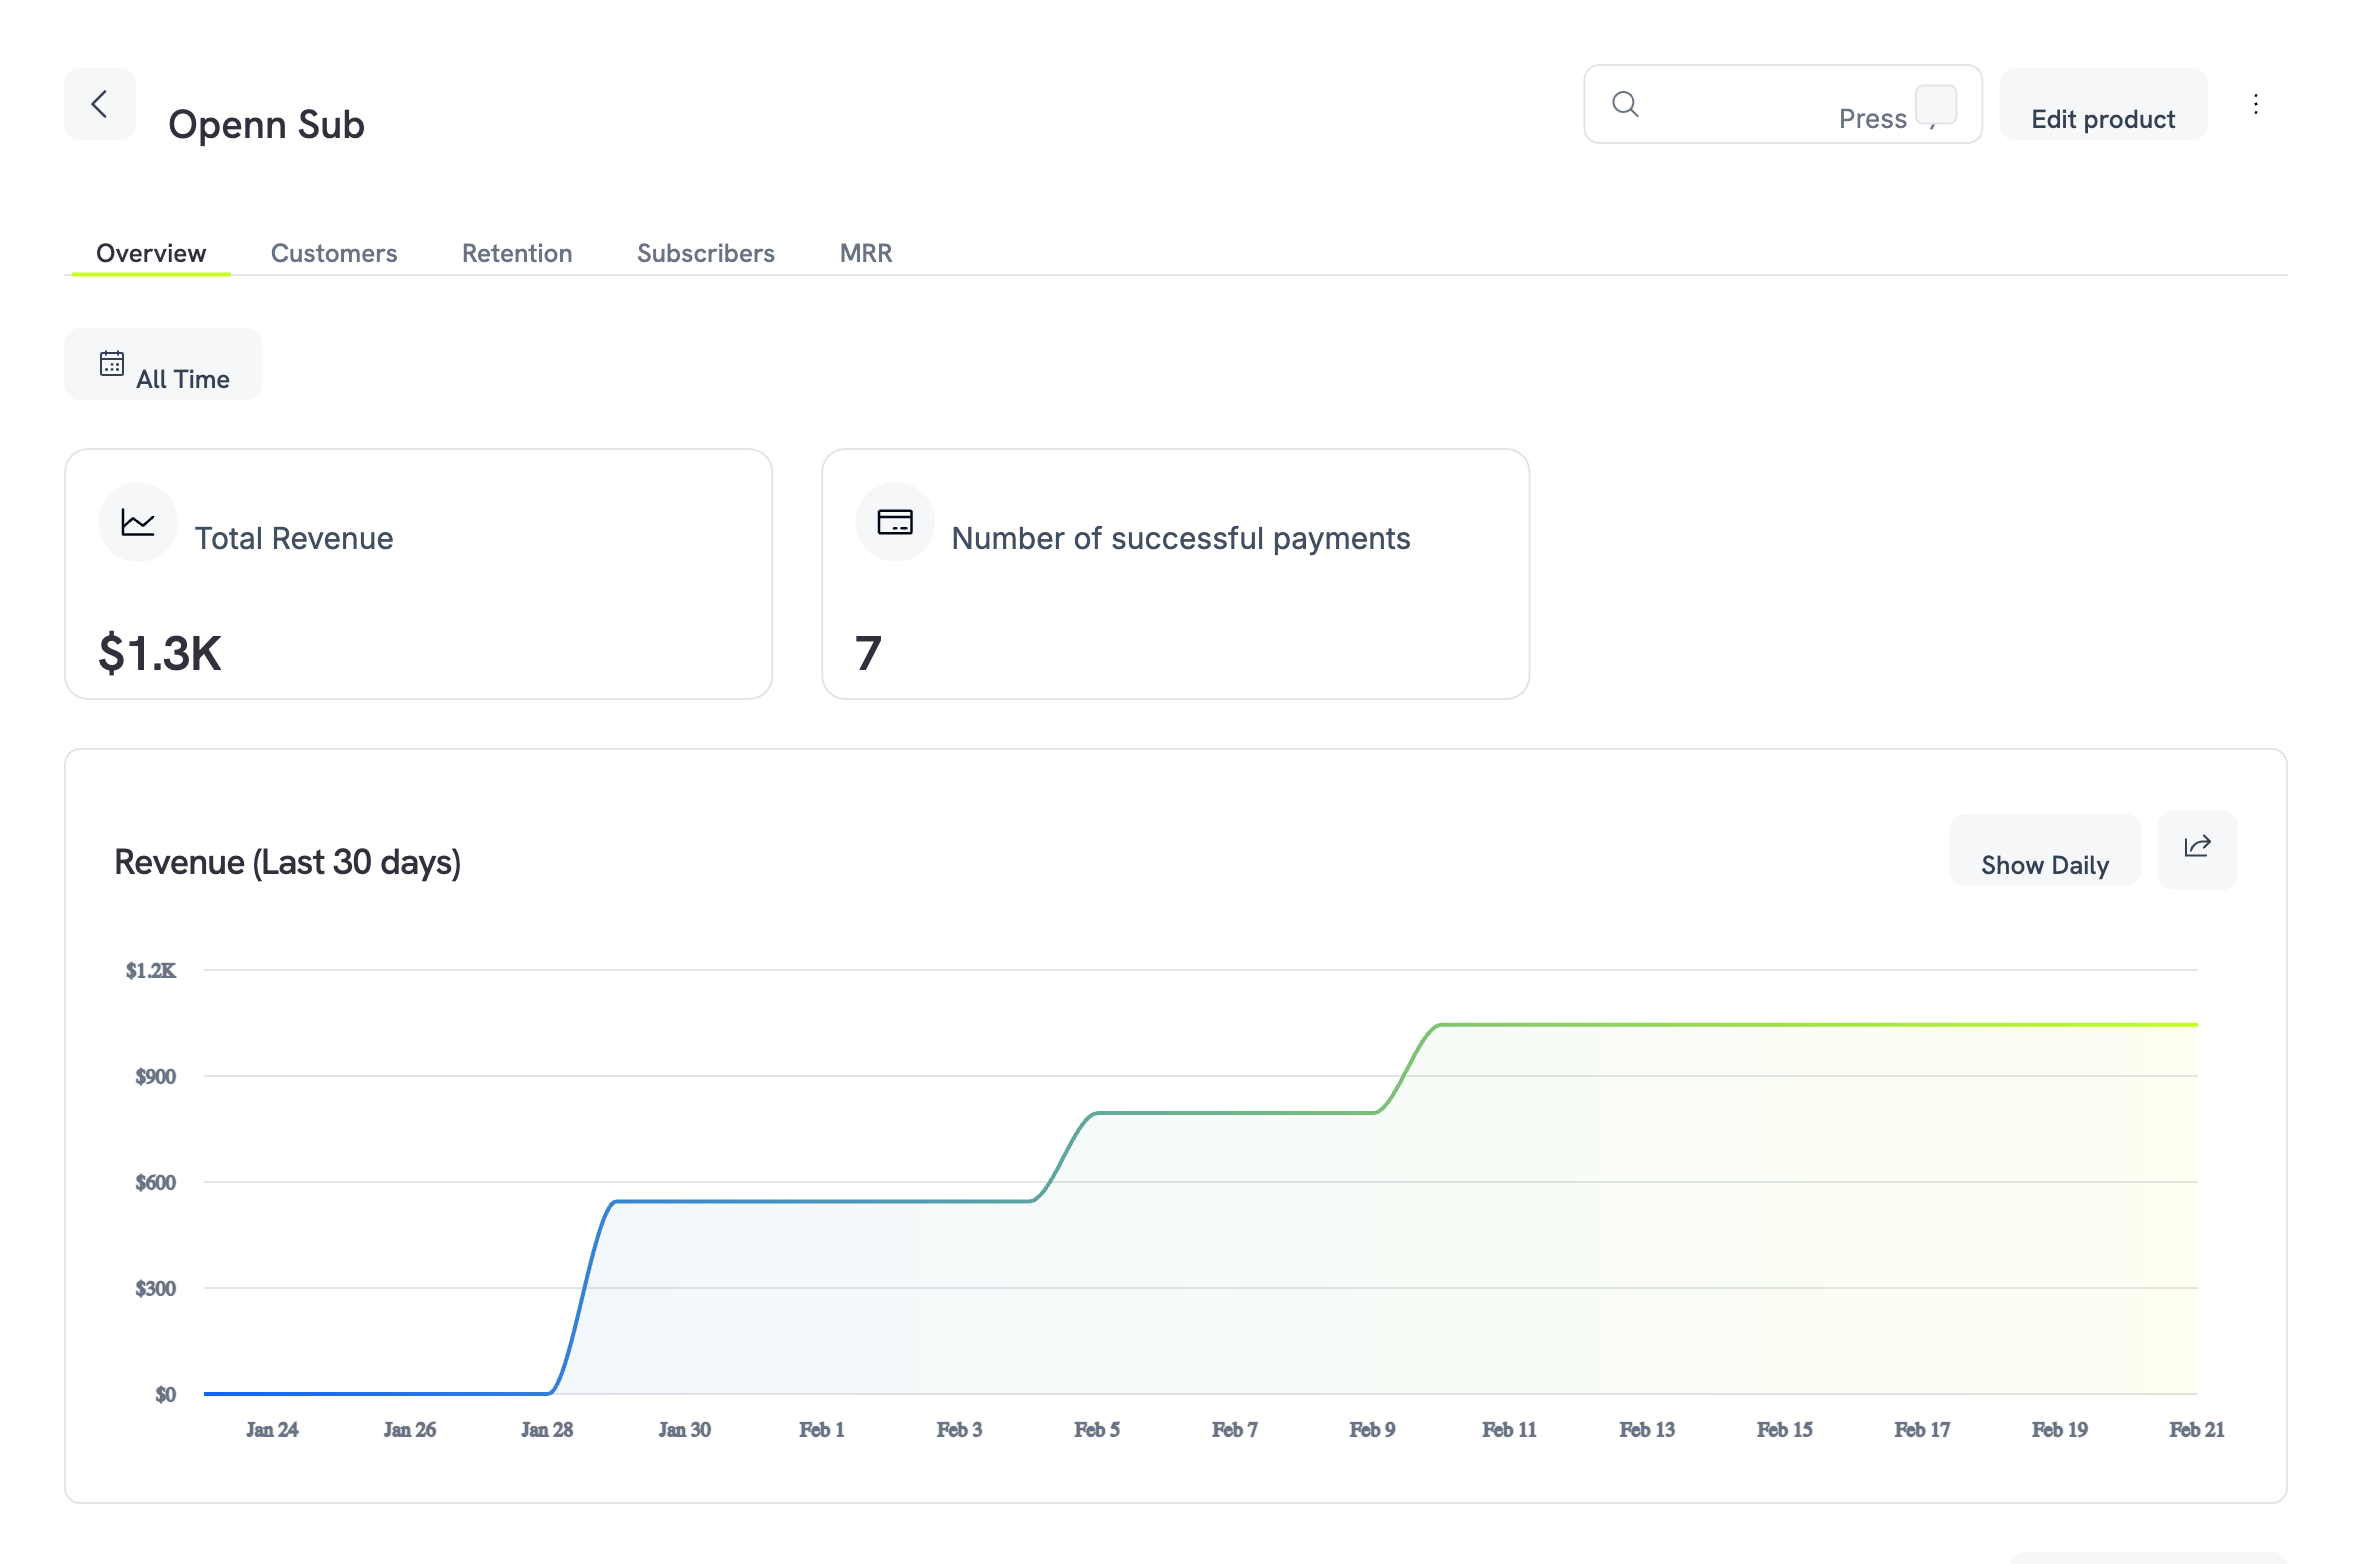 제품 분석 대시보드는 다섯 개의 탭으로 구성되어 있습니다:
수익 요약, 추세 차트, 거래 내역.
지출 기준 상위 고객 순위와 상세 테이블.
고객 및 수익 이탈률과 추세 분석.
상태 및 청구 정보를 포함한 모든 구독.
월별 반복 수익의 세부 분해 — 신규, 확장, 이탈, 순.
모든 탭은 **날짜 필터**(기본값은 전체 기간)를 지원하므로 원하는 기간에 집중할 수 있습니다.
### 개요 탭
개요 탭은 제품의 재무 성과에 대한 고수준 스냅샷을 제공합니다.
* **Total Revenue**: 이 제품에서 발생한 누적 수익.
* **Number of Successful Payments**: 성공한 거래의 전체 건수.
* **Revenue Trend Chart**: 30일 선형 차트로 수익 흐름을 보여줍니다. **Show Daily** 버튼으로 누적 뷰와 일별 뷰를 전환하세요.
차트 아래에는 이 제품의 모든 결제를 나열한 **Transactions** 테이블이 있습니다:
| Column | Description |
| -------------- | ------------------------ |
| Payment ID | 거래의 고유 식별자 |
| Status | `Successful` 또는 `Failed` |
| Amount | 통화 단위가 포함된 거래 금액 |
| Date (UTC) | 거래 시점의 타임스탬프 |
| Payment Method | 사용된 카드, UPI 또는 기타 결제 수단 |
| Refund | 환불을 시작할 수 있는 옵션 |
제품 분석 대시보드는 다섯 개의 탭으로 구성되어 있습니다:
수익 요약, 추세 차트, 거래 내역.
지출 기준 상위 고객 순위와 상세 테이블.
고객 및 수익 이탈률과 추세 분석.
상태 및 청구 정보를 포함한 모든 구독.
월별 반복 수익의 세부 분해 — 신규, 확장, 이탈, 순.
모든 탭은 **날짜 필터**(기본값은 전체 기간)를 지원하므로 원하는 기간에 집중할 수 있습니다.
### 개요 탭
개요 탭은 제품의 재무 성과에 대한 고수준 스냅샷을 제공합니다.
* **Total Revenue**: 이 제품에서 발생한 누적 수익.
* **Number of Successful Payments**: 성공한 거래의 전체 건수.
* **Revenue Trend Chart**: 30일 선형 차트로 수익 흐름을 보여줍니다. **Show Daily** 버튼으로 누적 뷰와 일별 뷰를 전환하세요.
차트 아래에는 이 제품의 모든 결제를 나열한 **Transactions** 테이블이 있습니다:
| Column | Description |
| -------------- | ------------------------ |
| Payment ID | 거래의 고유 식별자 |
| Status | `Successful` 또는 `Failed` |
| Amount | 통화 단위가 포함된 거래 금액 |
| Date (UTC) | 거래 시점의 타임스탬프 |
| Payment Method | 사용된 카드, UPI 또는 기타 결제 수단 |
| Refund | 환불을 시작할 수 있는 옵션 |
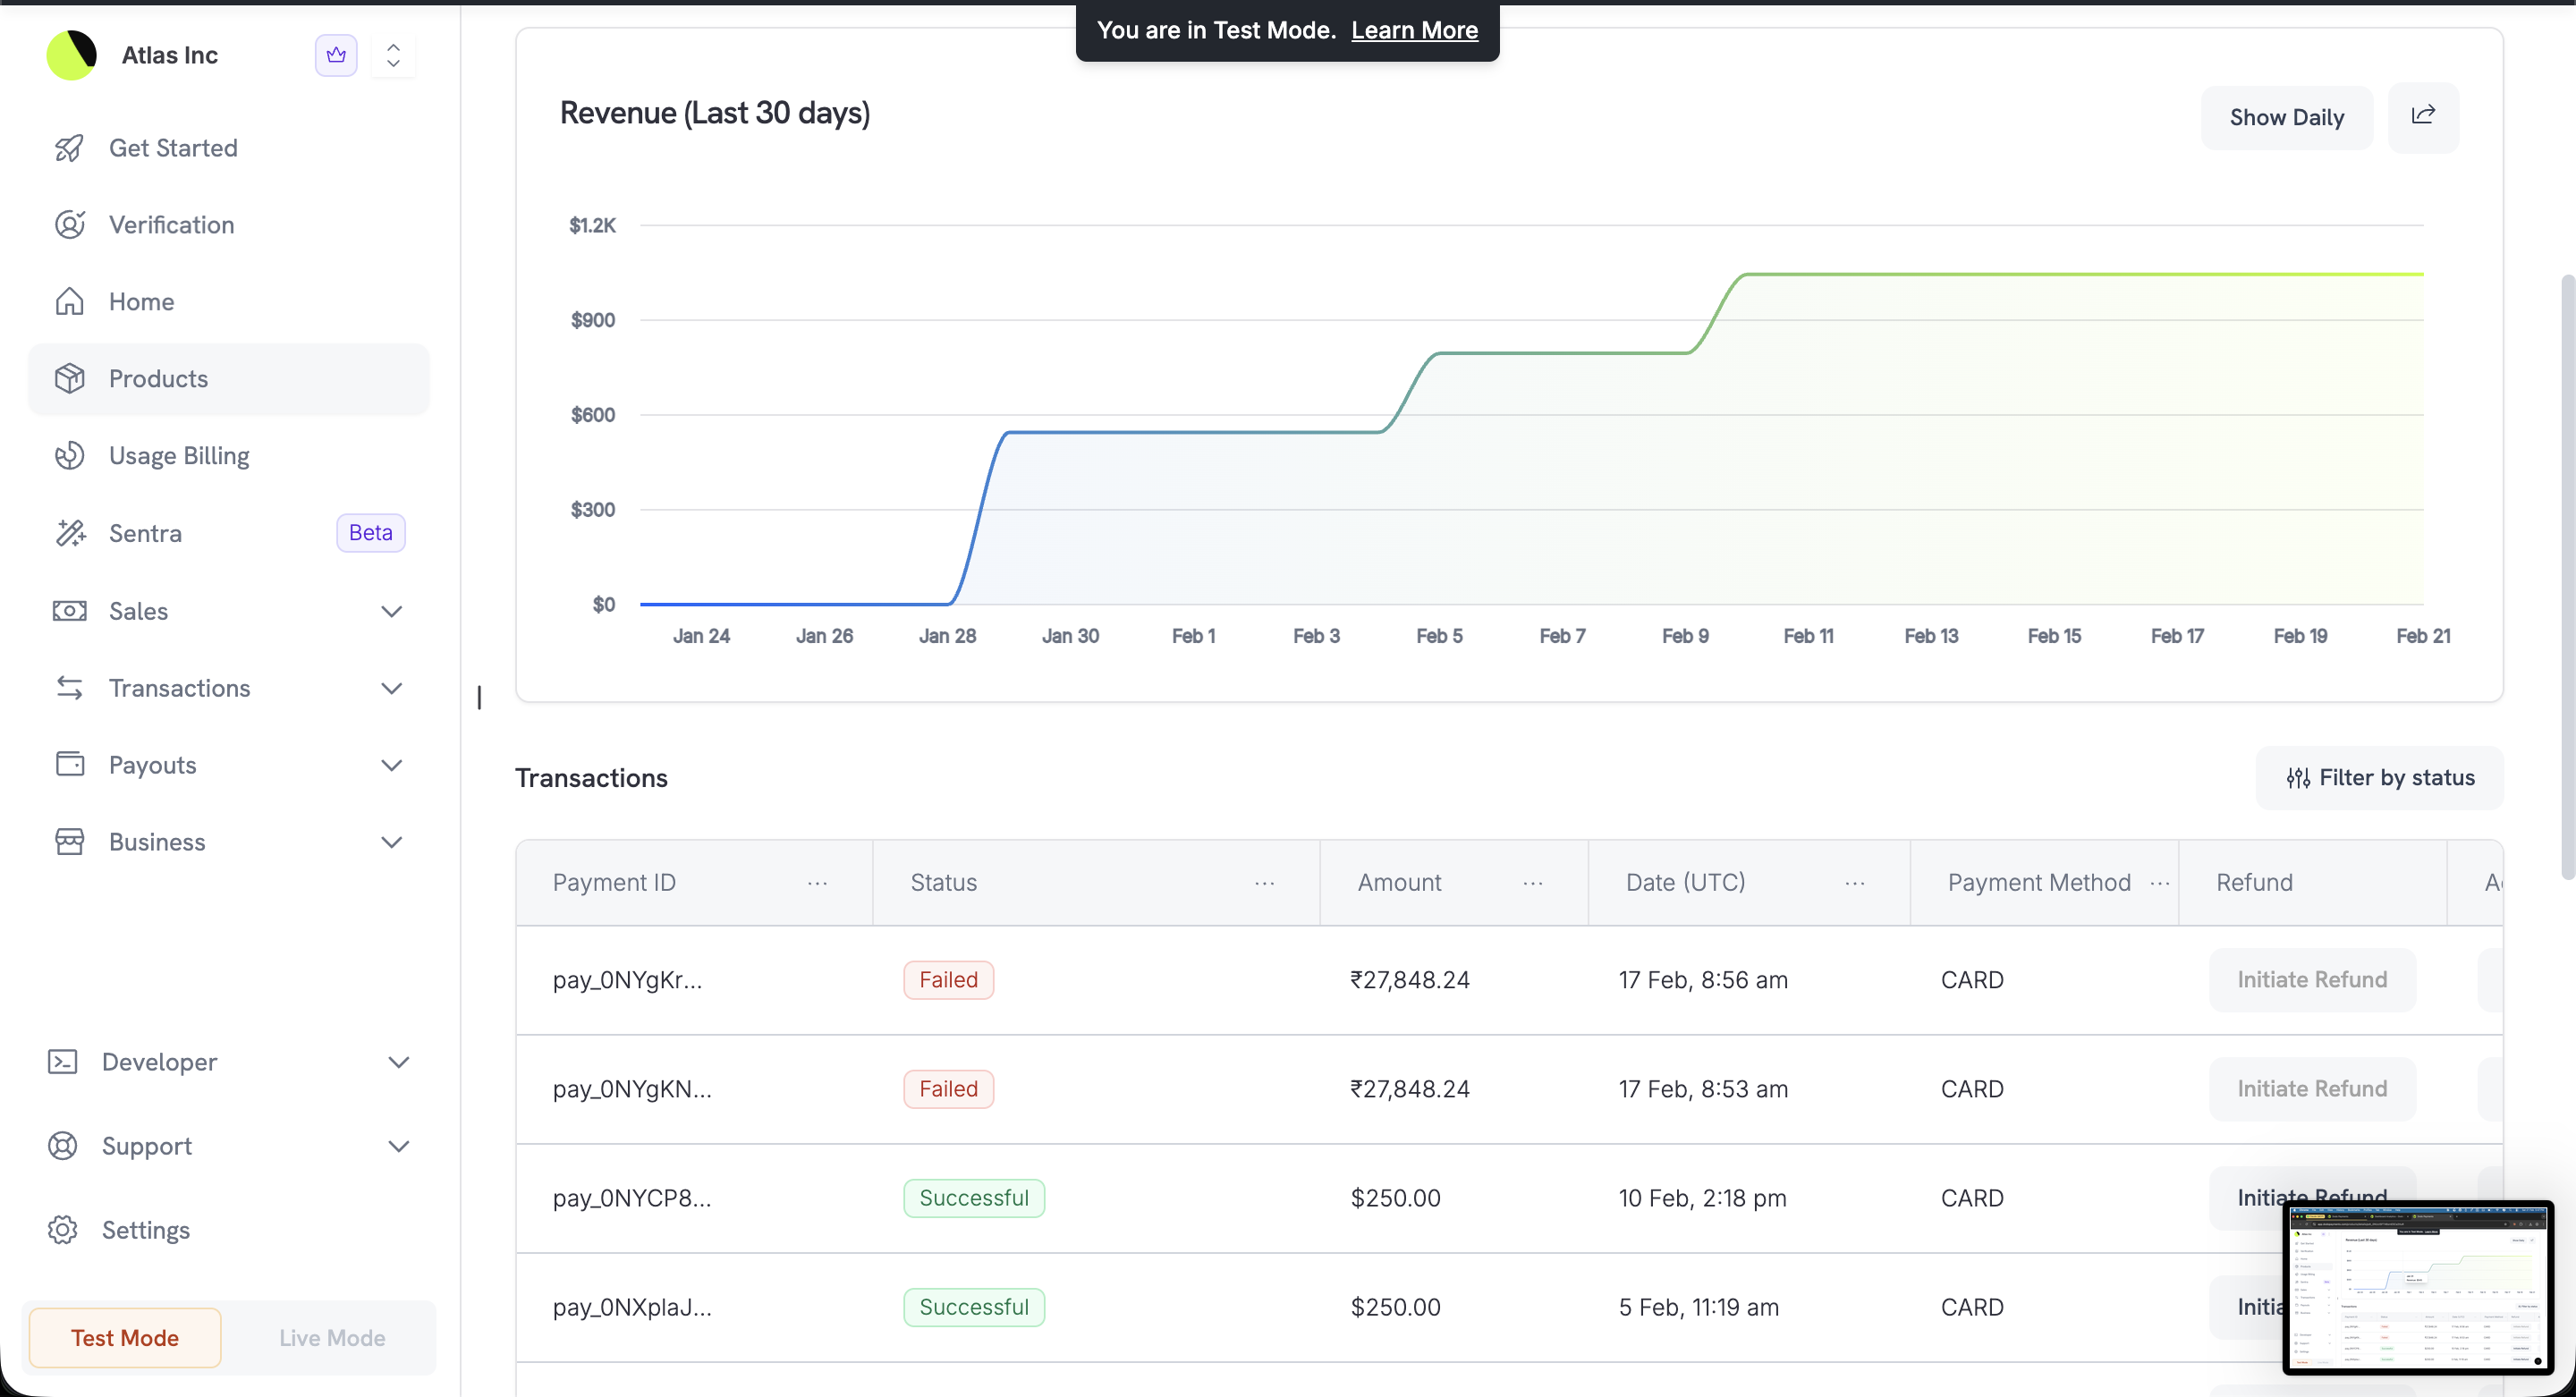 **Filter by status** 버튼을 사용하여 성공 또는 실패 거래만 표시하도록 목록을 좁히세요.
### 고객 탭
이 제품을 구매하는 고객과 그들이 지출하는 금액을 확인하세요.
**Filter by status** 버튼을 사용하여 성공 또는 실패 거래만 표시하도록 목록을 좁히세요.
### 고객 탭
이 제품을 구매하는 고객과 그들이 지출하는 금액을 확인하세요.
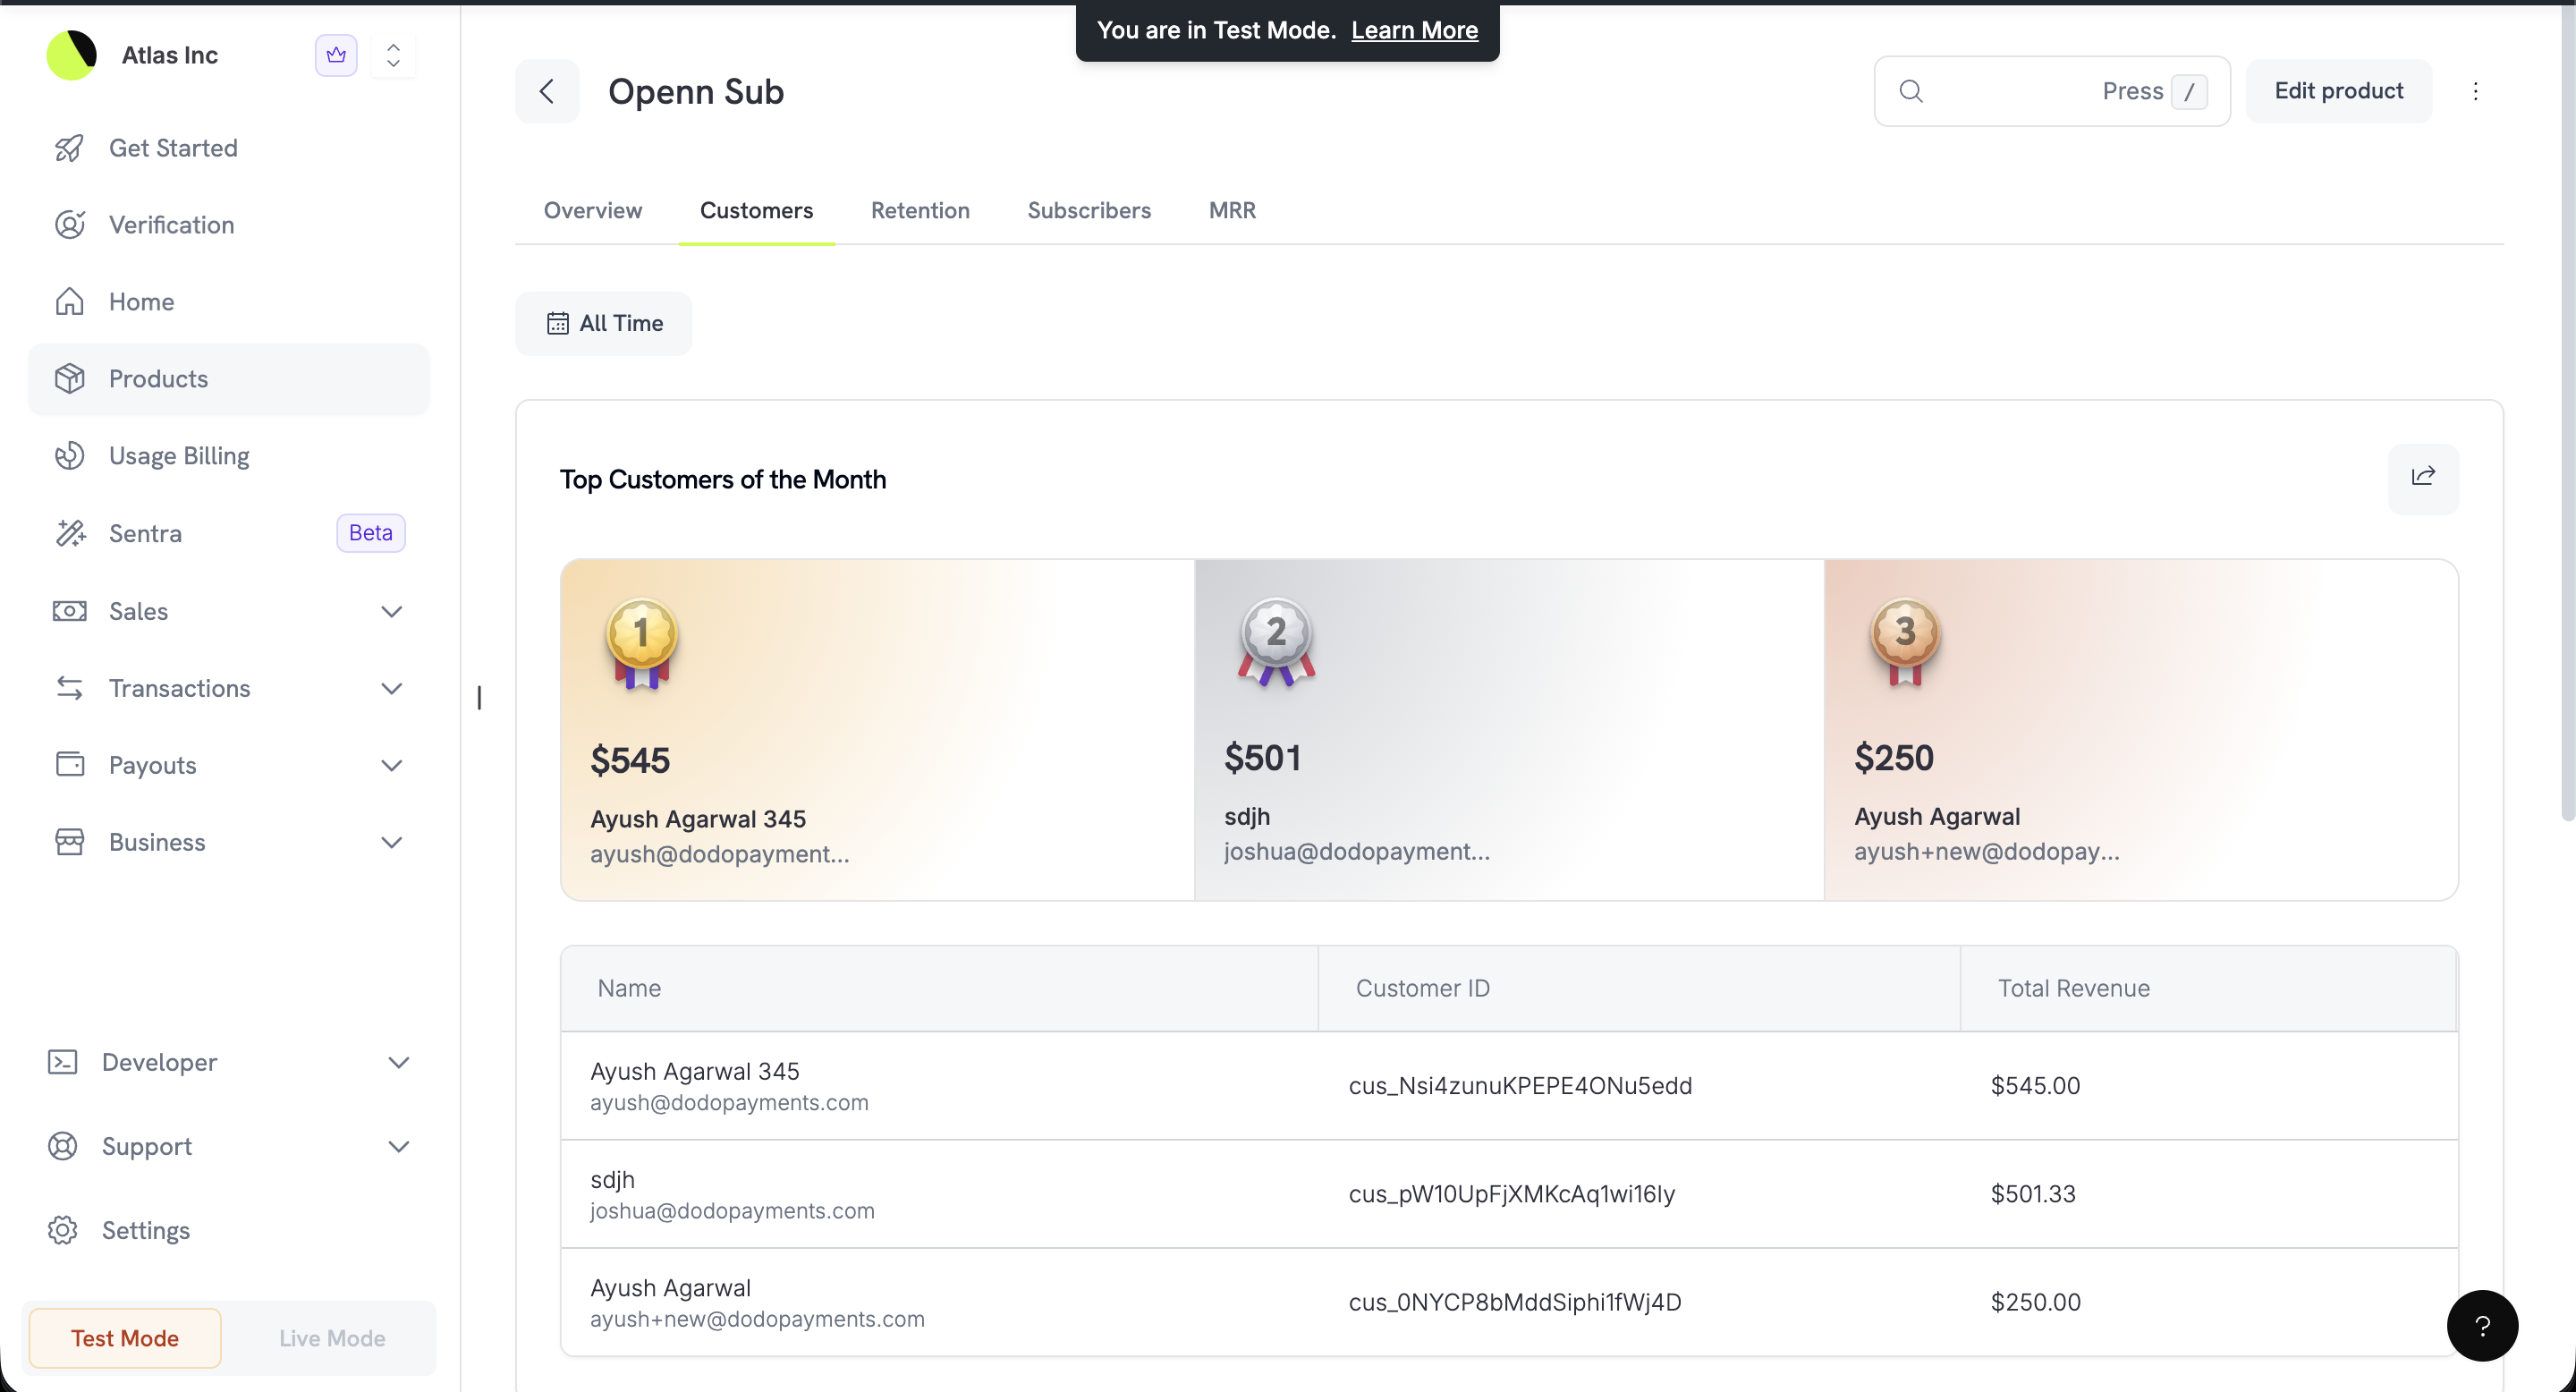 * **Top Customers of the Month**: 총 지출 기준으로 순위가 매겨진 **상위 3명 고객**을 보여주는 시각적 포디움과 수익 금액, 이름, 이메일.
* **Customer Table**: 고객 ID 및 이 제품에 대한 총 수익을 포함한 모든 고객의 상세 내역.
### 리텐션 탭
이 제품이 구독자를 얼마나 잘 유지하는지 파악하세요.
* **Top Customers of the Month**: 총 지출 기준으로 순위가 매겨진 **상위 3명 고객**을 보여주는 시각적 포디움과 수익 금액, 이름, 이메일.
* **Customer Table**: 고객 ID 및 이 제품에 대한 총 수익을 포함한 모든 고객의 상세 내역.
### 리텐션 탭
이 제품이 구독자를 얼마나 잘 유지하는지 파악하세요.
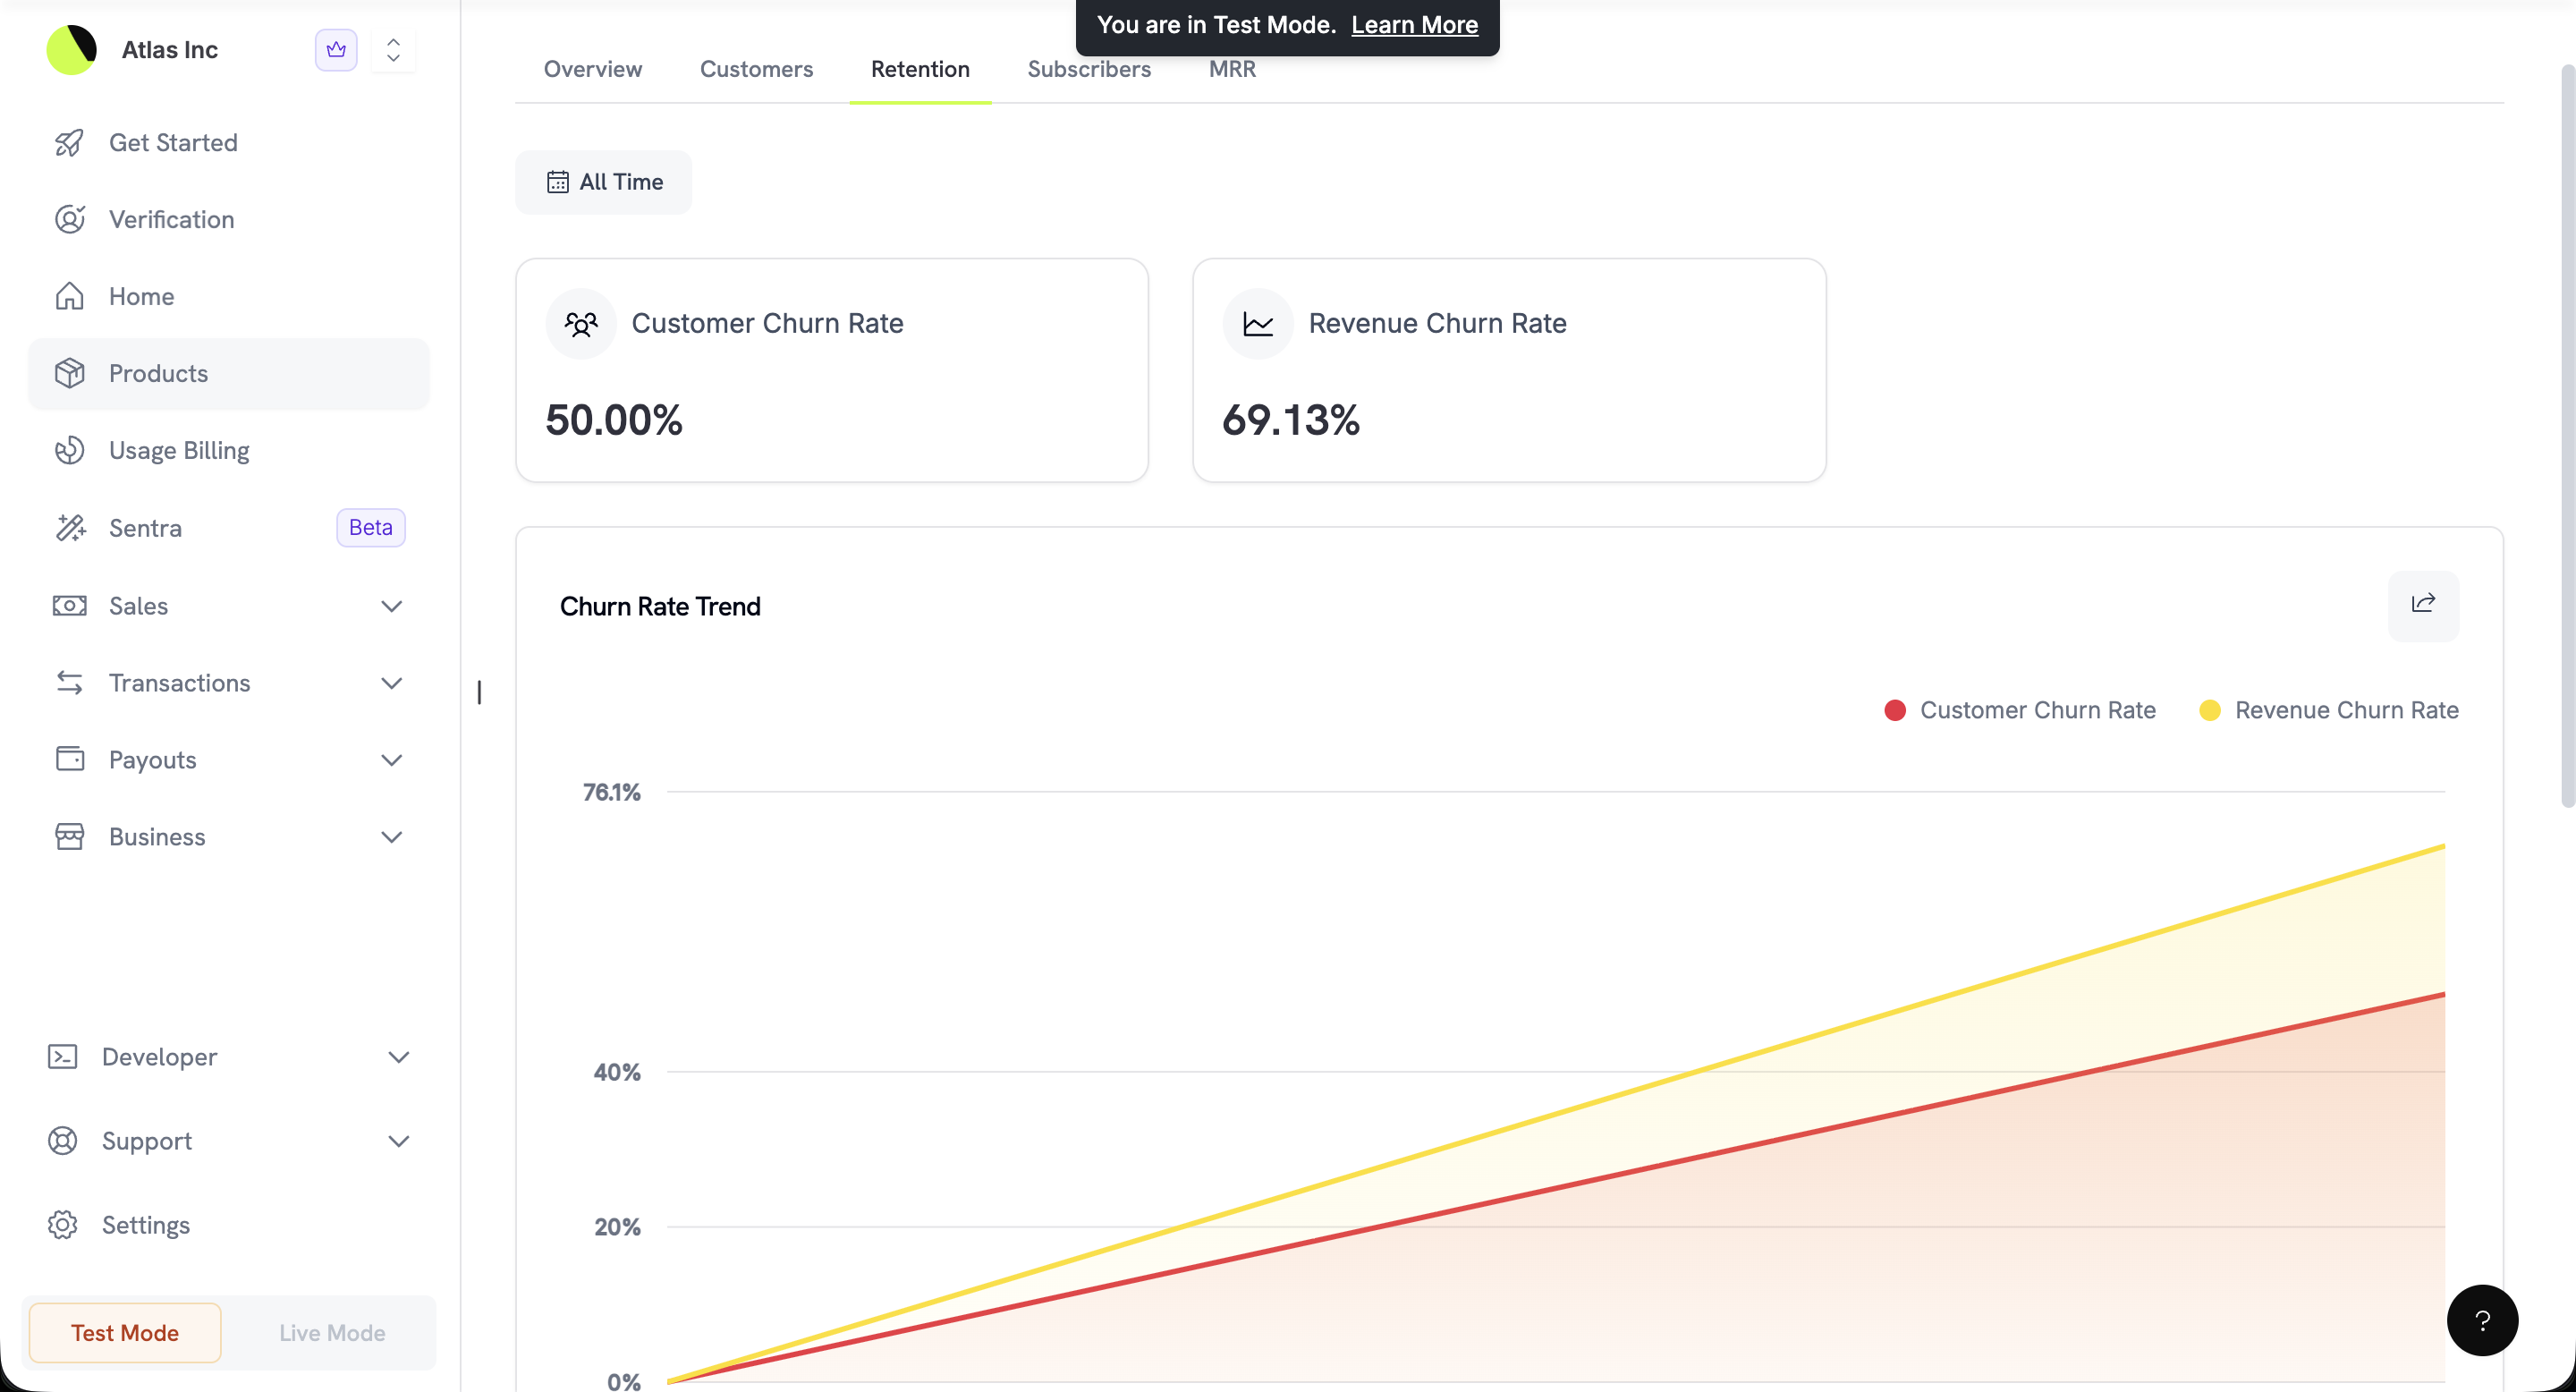 * **Customer Churn Rate**: 구독을 취소한 고객의 비율.
* **Revenue Churn Rate**: 취소 및 다운그레이드로 손실된 수익의 비율.
* **Churn Rate Trend**: 두 지표를 시간 경과에 따라 추적하는 이중 선형 차트로 추세를 파악하고 교정 조치를 취하세요.
### 구독자 탭
이 제품에 연결된 모든 구독의 전체 목록입니다.
* **Customer Churn Rate**: 구독을 취소한 고객의 비율.
* **Revenue Churn Rate**: 취소 및 다운그레이드로 손실된 수익의 비율.
* **Churn Rate Trend**: 두 지표를 시간 경과에 따라 추적하는 이중 선형 차트로 추세를 파악하고 교정 조치를 취하세요.
### 구독자 탭
이 제품에 연결된 모든 구독의 전체 목록입니다.
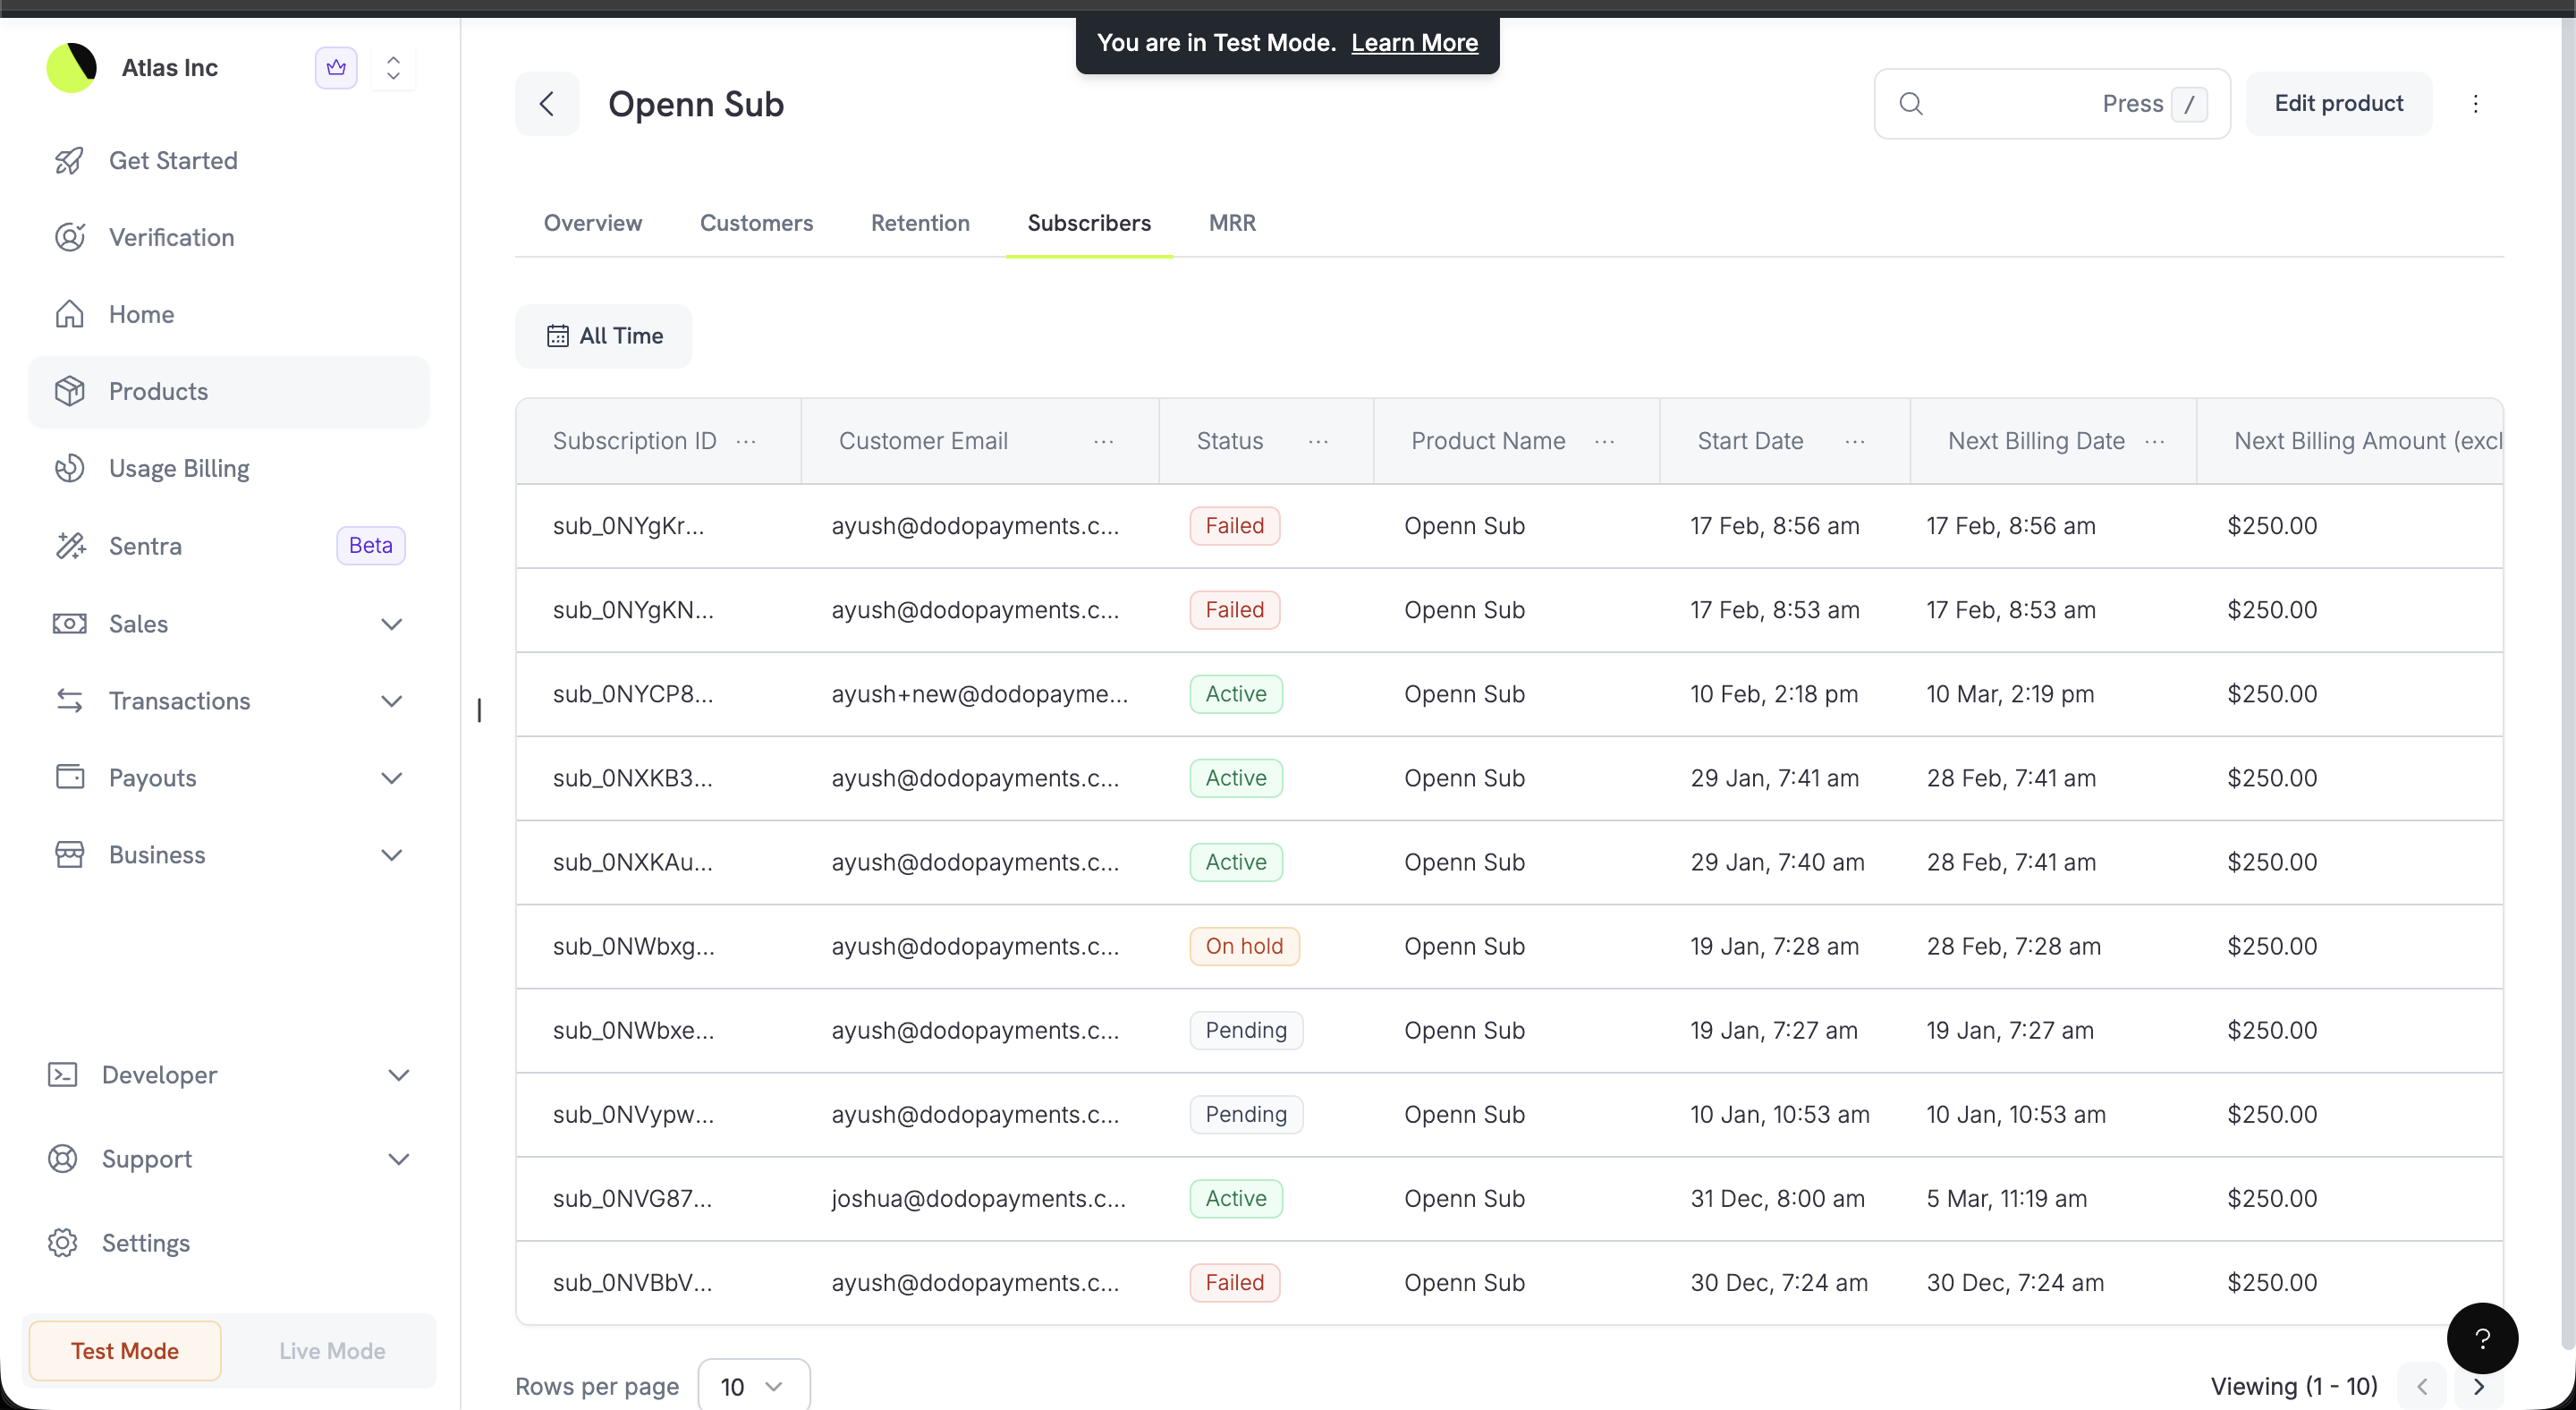 | Column | Description |
| ------------------- | ------------------------------------------ |
| Subscription ID | 구독의 고유 식별자 |
| Customer Email | 구독자 이메일 주소 |
| Status | `Active`, `Failed`, `On hold` 또는 `Pending` |
| Product Name | 이 구독이 속한 제품 |
| Start Date | 구독이 시작된 날짜 |
| Next Billing Date | 다음 갱신 예정일 |
| Next Billing Amount | 다음 갱신 시 납부할 금액(세금 제외) |
### MRR 탭
제품의 월간 반복 수익에 대한 상세한 분해 정보입니다.
| Column | Description |
| ------------------- | ------------------------------------------ |
| Subscription ID | 구독의 고유 식별자 |
| Customer Email | 구독자 이메일 주소 |
| Status | `Active`, `Failed`, `On hold` 또는 `Pending` |
| Product Name | 이 구독이 속한 제품 |
| Start Date | 구독이 시작된 날짜 |
| Next Billing Date | 다음 갱신 예정일 |
| Next Billing Amount | 다음 갱신 시 납부할 금액(세금 제외) |
### MRR 탭
제품의 월간 반복 수익에 대한 상세한 분해 정보입니다.
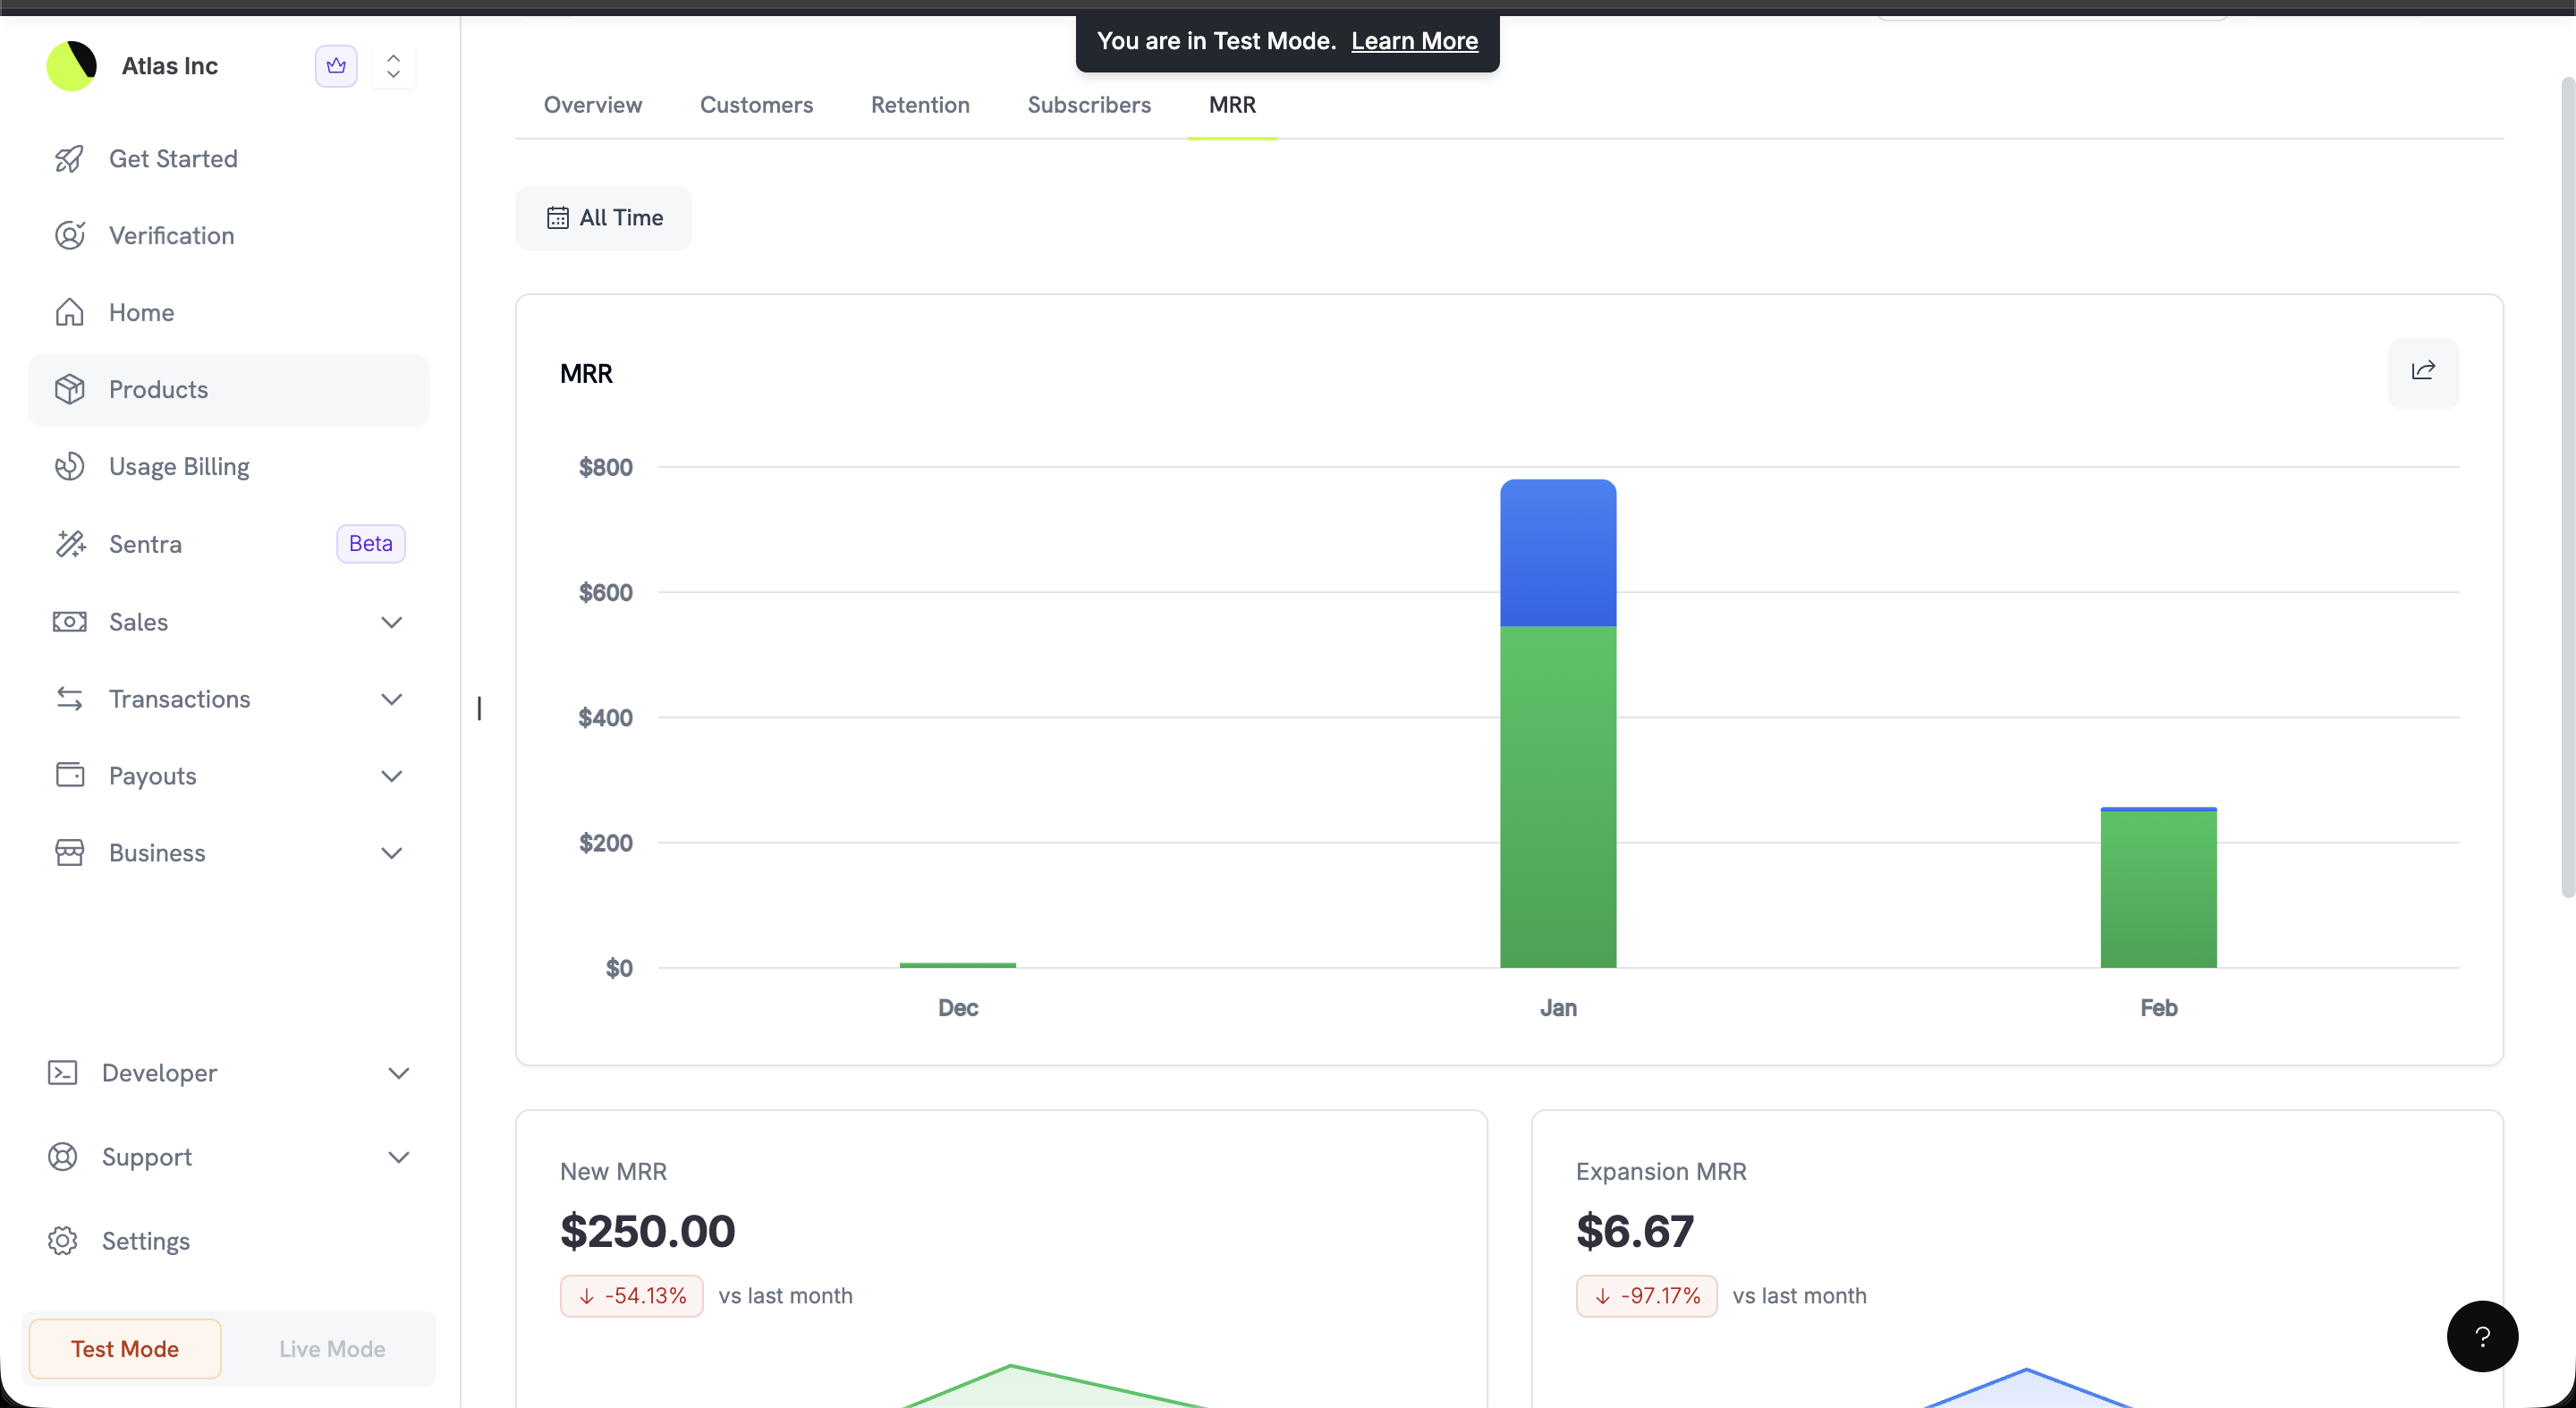 **MRR 차트**는 누적 막대 차트로 매월 반복 수익 구성 요소를 시각화합니다.
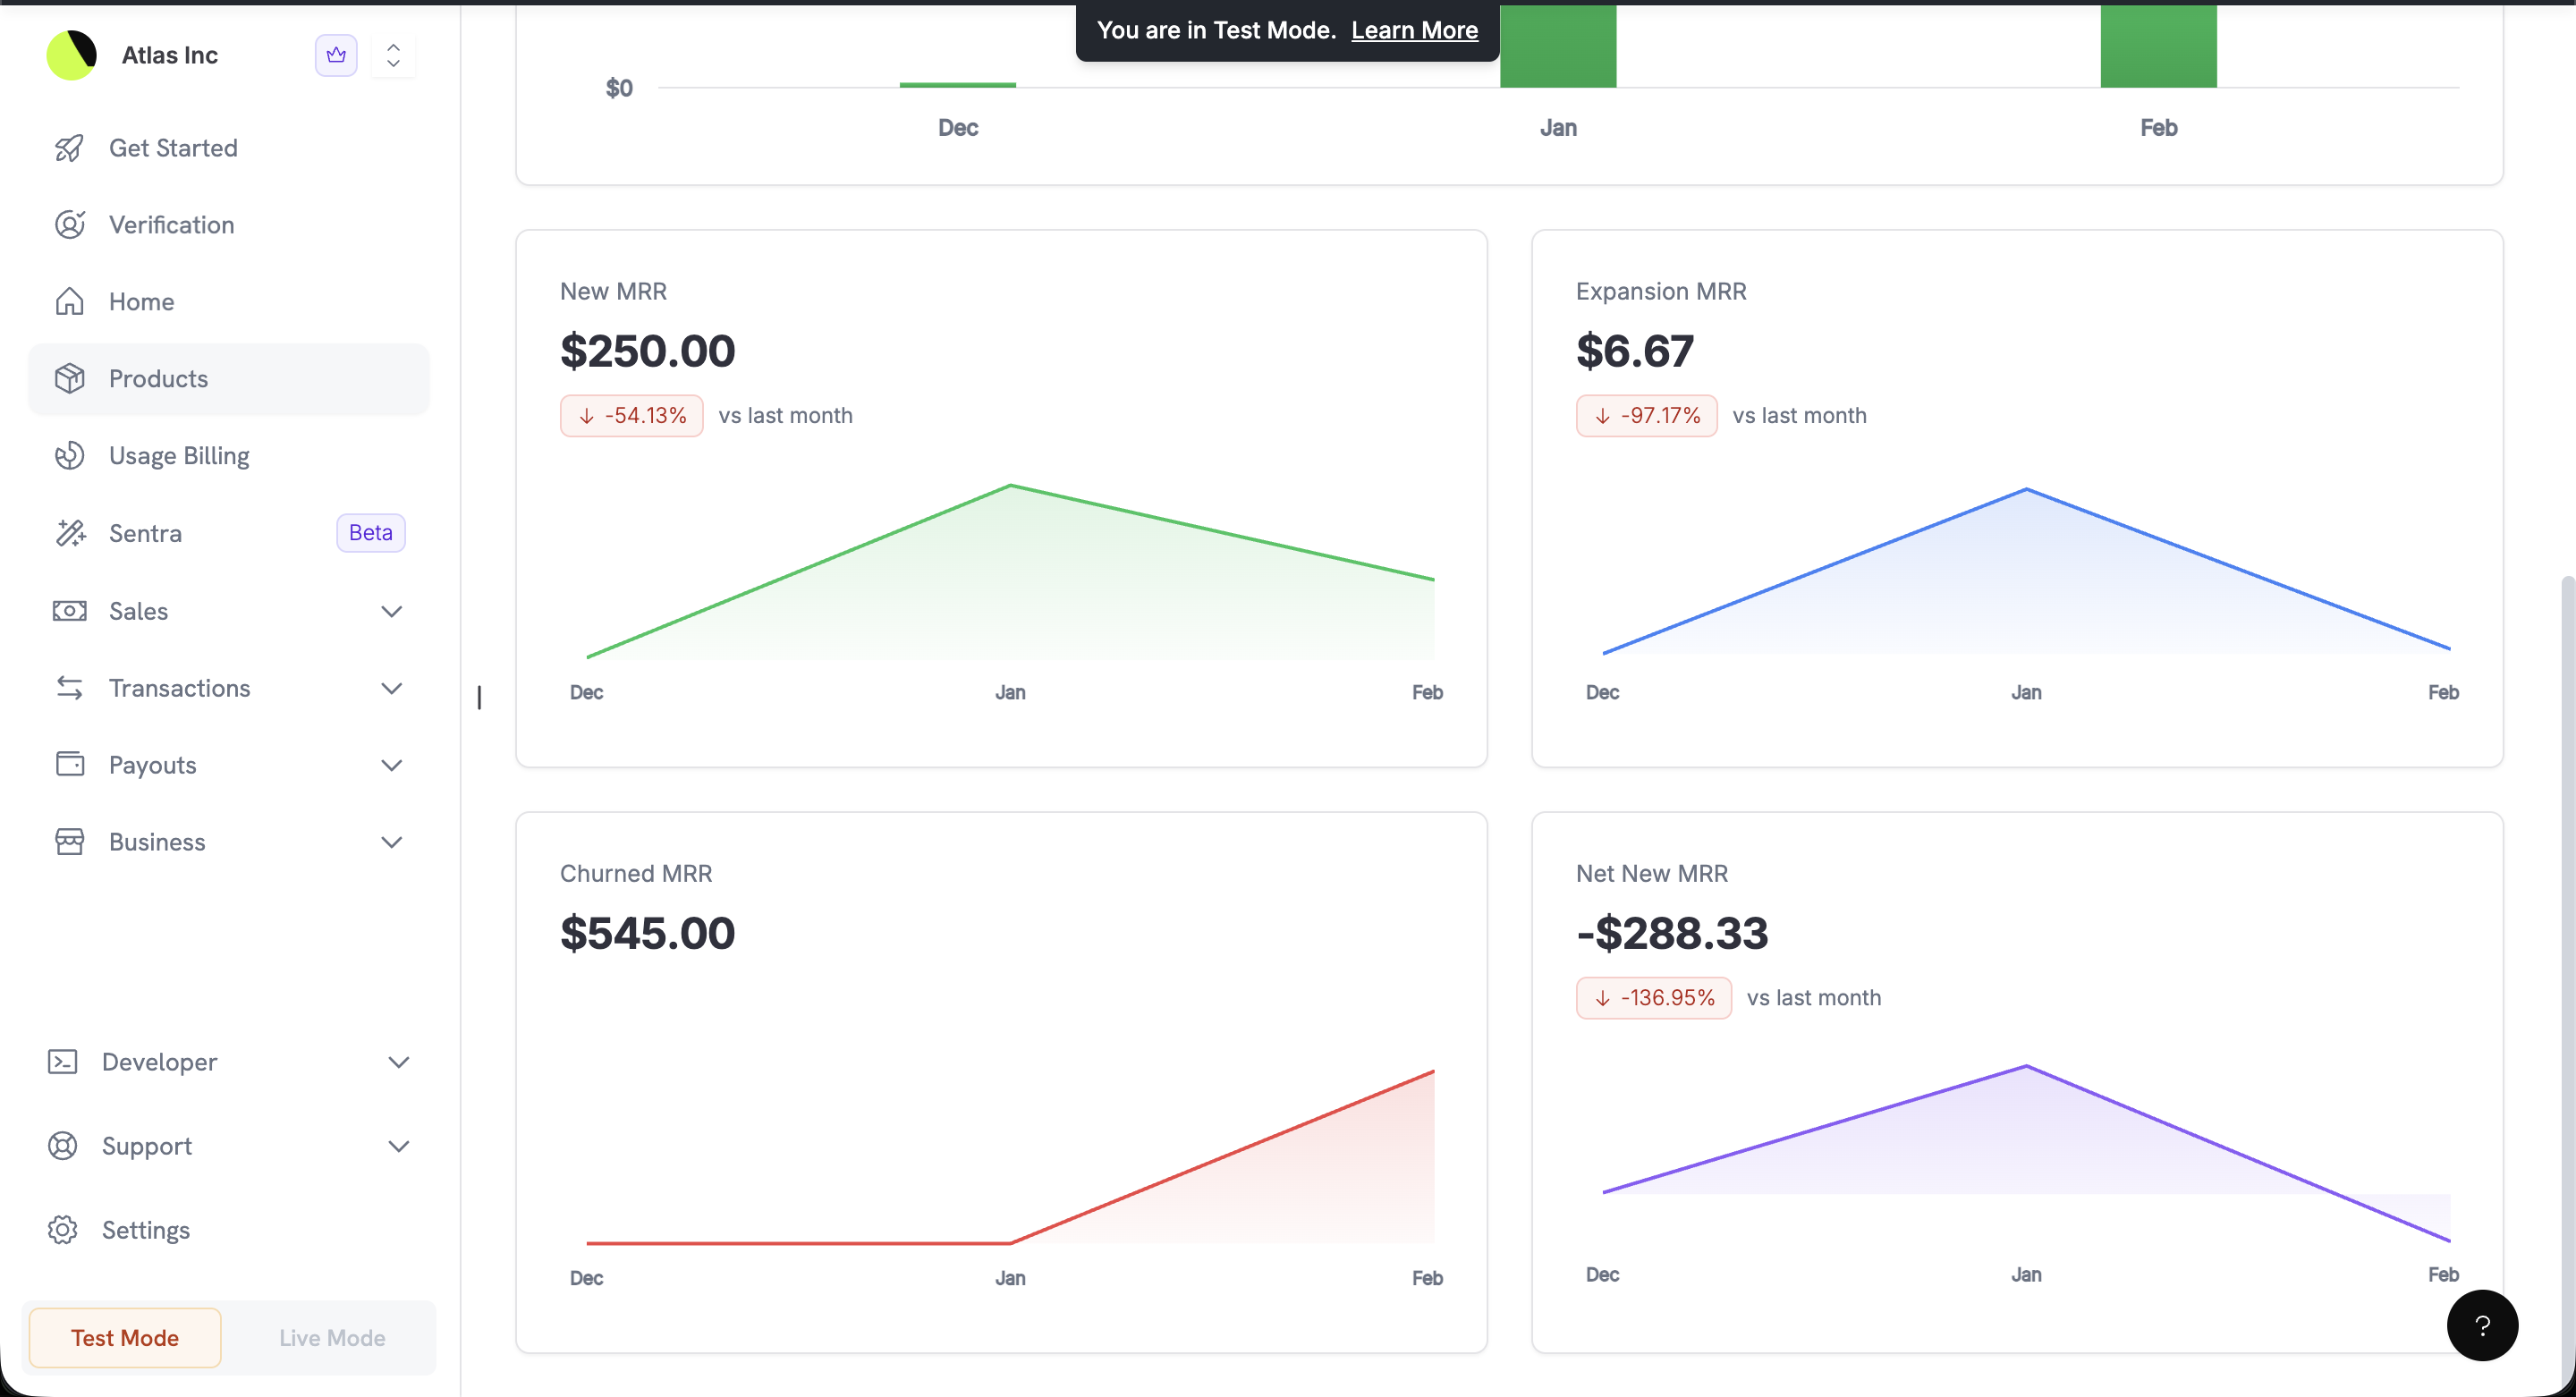
차트 아래에는 네 개의 메트릭 카드가 자세한 인사이트를 제공합니다:
**MRR 차트**는 누적 막대 차트로 매월 반복 수익 구성 요소를 시각화합니다.
차트 아래에는 네 개의 메트릭 카드가 자세한 인사이트를 제공합니다:
 | Metric | Description |
| ----------------- | ---------------------------------------- |
| **New MRR** | 이번 달에 확보한 신규 구독으로 인한 수익과 전월 대비 변화율 |
| **Expansion MRR** | 기존 구독자가 요금제 업그레이드나 추가 기능으로 인해 발생시킨 추가 수익 |
| **Churned MRR** | 취소되거나 다운그레이드된 구독으로 인한 수익 손실 |
| **Net New MRR** | 신규 MRR + 확장 MRR − 이탈 MRR의 순 결과 |
각 카드에는 추세 미니 차트와 전월 대비 백분율 변화 지표가 포함되어 있습니다.
***
## 보고서
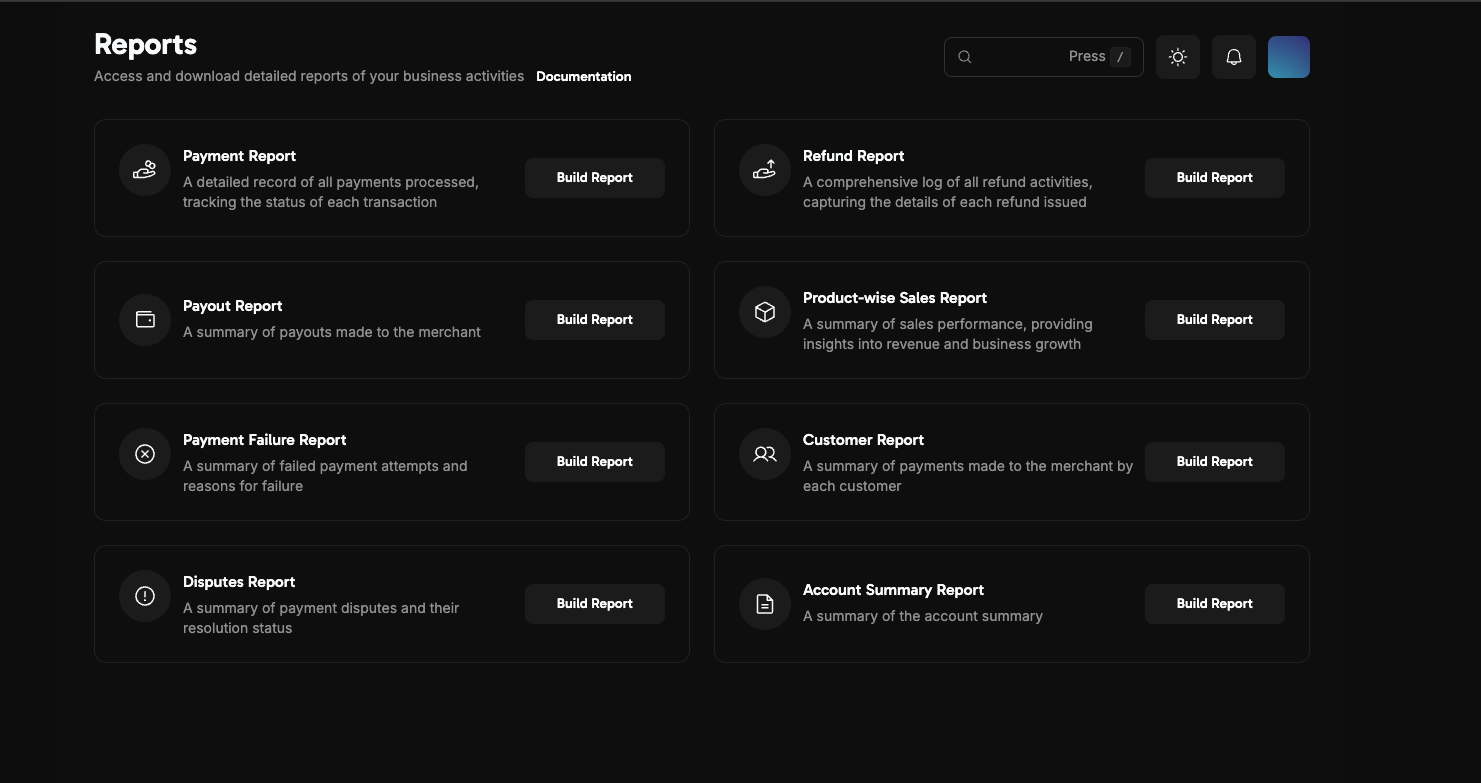
대시보드에서 **보고서** 섹션으로 이동하여 보고 모음을 액세스합니다.
사용 가능한 보고서:
* **Payment Report**: 거래 상태 추적과 함께 처리된 모든 결제의 상세 기록
* **Refund Report**: 환불 활동에 대한 상세한 로그
* **Payout Report**: 계정으로 진행된 지급 내역 요약
* **Product-wise Sales Report**: 수익과 비즈니스 성장 지표를 포함한 제품별 판매 실적
* **Payment Failure Report**: 실패한 결제 시도 요약과 실패 원인
* **Customer Report**: 고객별로 정리된 결제 요약
* **Disputes Report**: 해결 상태가 포함된 결제 분쟁 요약
* **Account Summary Report**: 전체 계정 개요 및 요약
| Metric | Description |
| ----------------- | ---------------------------------------- |
| **New MRR** | 이번 달에 확보한 신규 구독으로 인한 수익과 전월 대비 변화율 |
| **Expansion MRR** | 기존 구독자가 요금제 업그레이드나 추가 기능으로 인해 발생시킨 추가 수익 |
| **Churned MRR** | 취소되거나 다운그레이드된 구독으로 인한 수익 손실 |
| **Net New MRR** | 신규 MRR + 확장 MRR − 이탈 MRR의 순 결과 |
각 카드에는 추세 미니 차트와 전월 대비 백분율 변화 지표가 포함되어 있습니다.
***
## 보고서
대시보드에서 **보고서** 섹션으로 이동하여 보고 모음을 액세스합니다.
사용 가능한 보고서:
* **Payment Report**: 거래 상태 추적과 함께 처리된 모든 결제의 상세 기록
* **Refund Report**: 환불 활동에 대한 상세한 로그
* **Payout Report**: 계정으로 진행된 지급 내역 요약
* **Product-wise Sales Report**: 수익과 비즈니스 성장 지표를 포함한 제품별 판매 실적
* **Payment Failure Report**: 실패한 결제 시도 요약과 실패 원인
* **Customer Report**: 고객별로 정리된 결제 요약
* **Disputes Report**: 해결 상태가 포함된 결제 분쟁 요약
* **Account Summary Report**: 전체 계정 개요 및 요약
 ### 지급 보고서
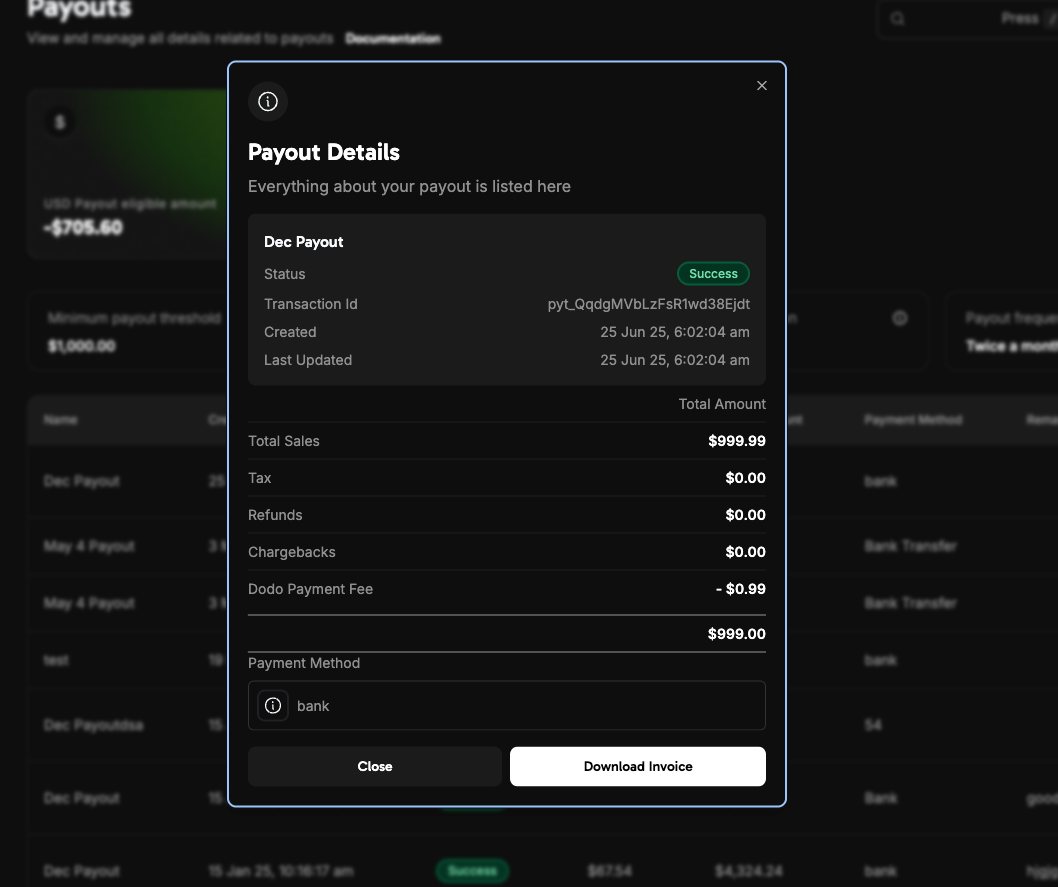
상세한 지급 보고서를 통해 각 지급의 수수료 및 거래 정보를 명확히 확인할 수 있습니다. **Business > Payouts**에서 확인하세요.
### 지급 보고서
상세한 지급 보고서를 통해 각 지급의 수수료 및 거래 정보를 명확히 확인할 수 있습니다. **Business > Payouts**에서 확인하세요.
 ### 보고서 다운로드
대시보드의 Reports 영역으로 이동하세요.
필요한 보고서(Payments, Refunds, Payouts)를 선택하고 날짜 범위를 지정하세요.
Download를 클릭하여 보고서를 CSV 형식으로 내보내세요.
보고서는 장치에 저장됩니다.
***
## 모범 사례
* 정기적으로 분석을 검토하여 추세와 이상 징후를 조기에 포착하세요.
* 필터를 사용하여 제품, 기간 또는 지역별 성과를 비교하세요.
* 제품 수준 분석을 통해 가장 많은 수익을 창출하는 제품과 이탈률이 높은 제품을 파악하세요.
* 데이터가 정확하지 않거나 누락된 것처럼 보이면 먼저 필터 및 날짜 범위 설정을 확인하세요.
지속적인 불일치나 데이터 누락이 보이면 [support@dodopayments.com](mailto:support@dodopayments.com)으로 문의하세요.
## 다음 단계
수익, 공제, 지급 주기를 이해하세요.
제품을 생성하고 관리하세요.
모든 결제 거래를 추적하고 관리하세요.
환불을 시작하고 모니터링하며 환불 보고서를 내보내세요.
### 보고서 다운로드
대시보드의 Reports 영역으로 이동하세요.
필요한 보고서(Payments, Refunds, Payouts)를 선택하고 날짜 범위를 지정하세요.
Download를 클릭하여 보고서를 CSV 형식으로 내보내세요.
보고서는 장치에 저장됩니다.
***
## 모범 사례
* 정기적으로 분석을 검토하여 추세와 이상 징후를 조기에 포착하세요.
* 필터를 사용하여 제품, 기간 또는 지역별 성과를 비교하세요.
* 제품 수준 분석을 통해 가장 많은 수익을 창출하는 제품과 이탈률이 높은 제품을 파악하세요.
* 데이터가 정확하지 않거나 누락된 것처럼 보이면 먼저 필터 및 날짜 범위 설정을 확인하세요.
지속적인 불일치나 데이터 누락이 보이면 [support@dodopayments.com](mailto:support@dodopayments.com)으로 문의하세요.
## 다음 단계
수익, 공제, 지급 주기를 이해하세요.
제품을 생성하고 관리하세요.
모든 결제 거래를 추적하고 관리하세요.
환불을 시작하고 모니터링하며 환불 보고서를 내보내세요.